Concept explainers
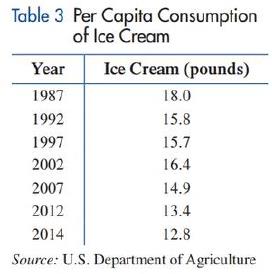
Diet. Table
(A) Let
(B) Use the polynomial model from part (A) to estimate (to the nearest tenth of a pound) the per capita consumption of ice cream in

Want to see the full answer?
Check out a sample textbook solution
Chapter 2 Solutions
FINITE MATH.F/BUS,ECON,LIFE..-ACCESS
Additional Math Textbook Solutions
Elementary Statistics (13th Edition)
Calculus: Early Transcendentals (2nd Edition)
A Problem Solving Approach To Mathematics For Elementary School Teachers (13th Edition)
College Algebra with Modeling & Visualization (5th Edition)
A First Course in Probability (10th Edition)
Pre-Algebra Student Edition
- A 10-ft boom is acted upon by the 810-lb force as shown in the figure. D 6 ft 6 ft E B 7 ft C 6 ft 4 ft W Determine the tension in each cable and the reaction at the ball-and-socket joint at A. The tension in cable BD is lb. The tension in cable BE is lb. The reaction at A is ( lb) i + Ib) j. (Include a minus sign if necessary.)arrow_forwardthe correct answer is A could you show me whyarrow_forwardWrite the negation for each of the following statements A. Rory plays basketball and terry plays basketball. B. Rory plays basketball or Jessie plays lacrosse. C. If Tony went to Macdonald’s, then Tony likes hamburgers.arrow_forward
- Galena Park ISD Area and Volume → C Delta Math Student Applicat x Delta Math Student Applicat xb Galena Park ISD Area and V x deltamath.com/app/student/3919669/26697249/697de3b5894b134a6f23adadf8d12b31 DeltaMath Question Watch Video Show Examples ← Back to Home Area and Volume Due: February 12 at 4:00 PM Grade: 0% Drag the yellow point until an accurate "height" of the triangle is drawn. Afterwards, fill out the empty boxes below to determine the area of the triangle. Area of a Triangle (Interactive) Area Puzzles (Rectangles/Squares) Volume of Prisms Calculator Estrella Tejada\ Zavaleta Log Out h=4.65 5 6.5 7 C 4 00 10 1 59 USarrow_forward15. (a) Find all the eigenvalues and their algebraic and geometric multiplicities. (b) Find bases for the corresponding eigenspaces. (c) Is the matrix is diagonalizable? Explain. If it is, then find P and D. 100 00 1 1arrow_forwardrespuestaarrow_forward
- Good Day, Kindly assist me with this query.arrow_forward12. Check to see if the following set of functions is orthogonal on the interval [0,3] with respect to the integral inner product. Show all work. Recall that a set of functions is orthogonal if all pairs of functions are orthogonal. πα {cos (777), sin (7), 1}arrow_forwardA 24-1 design has been used to investigate the effect of four factors on the resistivity of a silicon wafer. The data from this experiment are shown in Table 4. Table 4: Resistivity Experiment for Exercise 5 Run A B с D Resistivity 1 23 2 3 4 5 6 7 8 9 10 11 12 I+I+I+I+Oooo 0 0 ||++TI++o000 33.2 4.6 31.2 9.6 40.6 162.4 39.4 158.6 63.4 62.6 58.7 0 0 60.9 3 (a) Estimate the factor effects. Plot the effect estimates on a normal probability scale. (b) Identify a tentative model for this process. Fit the model and test for curvature. (c) Plot the residuals from the model in part (b) versus the predicted resistivity. Is there any indication on this plot of model inadequacy? (d) Construct a normal probability plot of the residuals. Is there any reason to doubt the validity of the normality assumption?arrow_forward
- 1. Check to see if the matrix below is (a) symmetric (b) skew-symmetric (c) orthogonal You need to check all three cases. 2. Compute the eigenvalues and verify that they satisfy the required properties for such matrix. (For example, if the matrix is symmetric, then the eigenvalues satisfy certain property. Likewise, if a matrix is skew-symmetric or if it is orthogonal.) 0.28 0.96 -0.96 0.28arrow_forward14. (a) Find all the eigenvalues and their algebraic and geometric multiplicities. (b) Find bases for the corresponding eigenspaces. (c) Is the matrix is diagonalizable? Explain. If it is, then find P and D. 5 2 -9 6arrow_forwardon donne f(x) da fonction derive dhe do fonction fcsos calcule f'(x) orans chacun des Cas sulants: 3 1) f(x)=5x-11, 2- f (x) = ->³ 3-1(x) = x² 12x +π; 4-f(x)=- 5-f(x) = 33-4x6-609)=-3x²+ 7= f(x) = x + 1.8-f(x) = 4 s-f(x) = x++ X+1 -x-1 2 I 3x-4 девоarrow_forward
 Glencoe Algebra 1, Student Edition, 9780079039897...AlgebraISBN:9780079039897Author:CarterPublisher:McGraw Hill
 Algebra & Trigonometry with Analytic GeometryAlgebraISBN:9781133382119Author:SwokowskiPublisher:Cengage
 College AlgebraAlgebraISBN:9781305115545Author:James Stewart, Lothar Redlin, Saleem WatsonPublisher:Cengage Learning
 College Algebra (MindTap Course List)AlgebraISBN:9781305652231Author:R. David Gustafson, Jeff HughesPublisher:Cengage Learning


