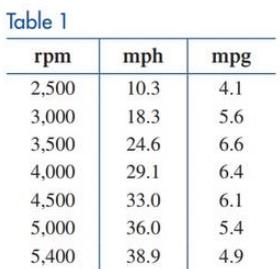
Refer to Table 1 . Use quadratic regression to find the best model of the form y = a x 2 + b x + c for boat speed y (in miles per hour) as a function of engine speed x (in revolutions per minute). Estimate the boat speed (in miles per hour, to one decimal place) at an engine speed of 3 , 400 rpm.
Refer to Table 1 . Use quadratic regression to find the best model of the form y = a x 2 + b x + c for boat speed y (in miles per hour) as a function of engine speed x (in revolutions per minute). Estimate the boat speed (in miles per hour, to one decimal place) at an engine speed of 3 , 400 rpm.
Solution Summary: The author calculates the best model of the form y=ax2+bx+c by using quadratic regression.
Refer to Table
1
. Use quadratic regression to find the best model of the form
y
=
a
x
2
+
b
x
+
c
for boat speed
y
(in miles per hour) as a function of engine speed
x
(in revolutions per minute). Estimate the boat speed (in miles per hour, to one decimal place) at an engine speed of
3
,
400
rpm.
Question 2
A nickel-titanium alloy is used to make components for jet turbine aircraft engines. Cracking is a potentially
serious problem in the final part because it can lead to nonrecoverable failure. A test is run at the parts producer
to determine the effect of four factors on cracks. The four factors are: pouring temperature (A), titanium content
(B), heat treatment method (C), amount of grain refiner used (D). Two replicates of a 24 design are run, and
the length of crack (in mm x10-2) induced in a sample coupon subjected to a standard test is measured. The
data are shown in Table 2.
1
(a) Estimate the factor effects. Which factor effects appear to be large?
(b) Conduct an analysis of variance. Do any of the factors affect cracking? Use a = 0.05.
(c) Write down a regression model that can be used to predict crack length as a function of the significant
main effects and interactions you have identified in part (b).
(d) Analyze the residuals from this experiment.
(e) Is there an…
Show the steps
The correct answer is C,i know that we need to use stokes theorem and parametrize the equations then write the equation F with respect to the curve but i cant seem to find a way to do it, the integral should be from 0 to 2pi but i might be wrongcould you show me the steps to get to 18pi
Need a deep-dive on the concept behind this application? Look no further. Learn more about this topic, subject and related others by exploring similar questions and additional content below.
Correlation Vs Regression: Difference Between them with definition & Comparison Chart; Author: Key Differences;https://www.youtube.com/watch?v=Ou2QGSJVd0U;License: Standard YouTube License, CC-BY
Correlation and Regression: Concepts with Illustrative examples; Author: LEARN & APPLY : Lean and Six Sigma;https://www.youtube.com/watch?v=xTpHD5WLuoA;License: Standard YouTube License, CC-BY


 College Algebra (MindTap Course List)AlgebraISBN:9781305652231Author:R. David Gustafson, Jeff HughesPublisher:Cengage Learning
 Algebra and Trigonometry (MindTap Course List)AlgebraISBN:9781305071742Author:James Stewart, Lothar Redlin, Saleem WatsonPublisher:Cengage Learning
 Algebra & Trigonometry with Analytic GeometryAlgebraISBN:9781133382119Author:SwokowskiPublisher:Cengage
 College AlgebraAlgebraISBN:9781305115545Author:James Stewart, Lothar Redlin, Saleem WatsonPublisher:Cengage Learning
 Algebra for College StudentsAlgebraISBN:9781285195780Author:Jerome E. Kaufmann, Karen L. SchwittersPublisher:Cengage Learning