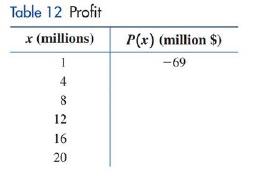
Profit. The financial department for the company in Problems 85 and 87 established the following cost function for producing and selling x million memory chips: C x = 125 + 16 x million dollars (a) Write a profit function for producing and selling x million memory chips and indicate its domain. (b) Complete Table 12 , computing profits to the nearest million dollars. (c) Plot the points in part (B) and sketch a graph of the profit function using these points.
Profit. The financial department for the company in Problems 85 and 87 established the following cost function for producing and selling x million memory chips: C x = 125 + 16 x million dollars (a) Write a profit function for producing and selling x million memory chips and indicate its domain. (b) Complete Table 12 , computing profits to the nearest million dollars. (c) Plot the points in part (B) and sketch a graph of the profit function using these points.
Profit. The financial department for the company in Problems
85
and
87
established the following cost function for producing and selling
x
million memory chips:
C
x
=
125
+
16
x
million dollars
(a) Write a profit function for producing and selling
x
million memory chips and indicate its domain.
(b) Complete Table
12
, computing profits to the nearest million dollars.
(c) Plot the points in part (B) and sketch a graph of the profit function using these points.
2. Consider the ODE
u' = ƒ (u) = u² + r
where r is a parameter that can take the values r = −1, −0.5, -0.1, 0.1. For each value of r:
(a) Sketch ƒ(u) = u² + r and determine the equilibrium points.
(b) Draw the phase line.
(d) Determine the stability of the equilibrium points.
(d) Plot the direction field and some sample solutions,i.e., u(t)
(e) Describe how location of the equilibrium points and their stability change as you increase the
parameter r.
(f) Using the matlab program phaseline.m generate a solution for each value of r and the initial
condition u(0) = 0.9. Print and turn in your result for r = −1. Do not forget to add a figure caption.
(g) In the matlab program phaseline.m set the initial condition to u(0) = 1.1 and simulate the ode
over the time interval t = [0, 10] for different values of r. What happens? Why? You do not need to
turn in a plot for (g), just describe what happens.
The following are suggested designs for group sequential studies. Using PROCSEQDESIGN, provide the following for the design O’Brien Fleming and Pocock.• The critical boundary values for each analysis of the data• The expected sample sizes at each interim analysisAssume the standardized Z score method for calculating boundaries.Investigators are evaluating the success rate of a novel drug for treating a certain type ofbacterial wound infection. Since no existing treatment exists, they have planned a one-armstudy. They wish to test whether the success rate of the drug is better than 50%, whichthey have defined as the null success rate. Preliminary testing has estimated the successrate of the drug at 55%. The investigators are eager to get the drug into production andwould like to plan for 9 interim analyses (10 analyzes in total) of the data. Assume thesignificance level is 5% and power is 90%.Besides, draw a combined boundary plot (OBF, POC, and HP)
Need a deep-dive on the concept behind this application? Look no further. Learn more about this topic, subject and related others by exploring similar questions and additional content below.


 Algebra for College StudentsAlgebraISBN:9781285195780Author:Jerome E. Kaufmann, Karen L. SchwittersPublisher:Cengage Learning
 Intermediate AlgebraAlgebraISBN:9781285195728Author:Jerome E. Kaufmann, Karen L. SchwittersPublisher:Cengage Learning