
Essentials of Statistics for Business and Economics
9th Edition
ISBN: 9780357118191
Author: David R. Anderson, Dennis J. Sweeney, Thomas A. Williams
Publisher: Cengage Learning US
expand_more
expand_more
format_list_bulleted
Concept explainers
Videos
Textbook Question
Chapter 2.4, Problem 37E
Consider the following data on two categorical variables. The first variable, x, can take on values A, B, C, or D. The second variable, y, can take on values I or II. The following table gives the frequency with which each combination occurs.
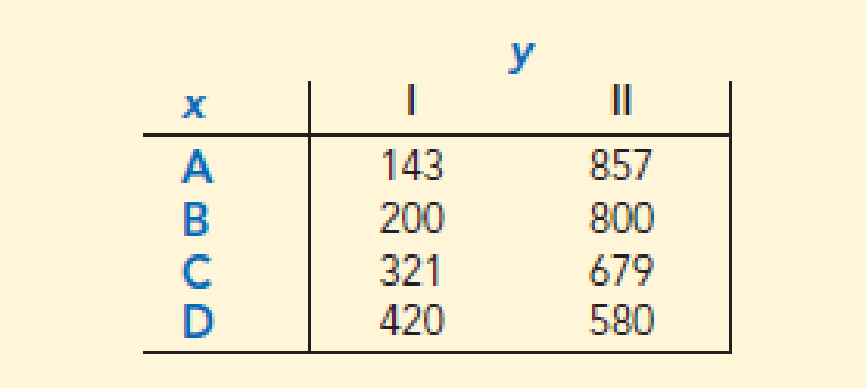
- a. Construct a side-by-side bar chart with x on the horizontal axis.
- b. Comment on the relationship between x and y.
Expert Solution & Answer
Want to see the full answer?
Check out a sample textbook solution
Students have asked these similar questions
Find binomial probability if:
x = 8, n = 10, p = 0.7
x= 3, n=5, p = 0.3
x = 4, n=7, p = 0.6
Quality Control: A factory produces light bulbs with a 2% defect rate. If a random sample of 20 bulbs is tested, what is the probability that exactly 2 bulbs are defective? (hint: p=2% or 0.02; x =2, n=20; use the same logic for the following problems)
Marketing Campaign: A marketing company sends out 1,000 promotional emails. The probability of any email being opened is 0.15. What is the probability that exactly 150 emails will be opened? (hint: total emails or n=1000, x =150)
Customer Satisfaction: A survey shows that 70% of customers are satisfied with a new product. Out of 10 randomly selected customers, what is the probability that at least 8 are satisfied? (hint: One of the keyword in this question is “at least 8”, it is not “exactly 8”, the correct formula for this should be = 1- (binom.dist(7, 10, 0.7, TRUE)). The part in the princess will give you the probability of seven and less than…
please answer these questions
Selon une économiste d’une société financière, les dépenses moyennes pour « meubles et appareils de maison » ont été moins importantes pour les ménages de la région de Montréal, que celles de la région de Québec.
Un échantillon aléatoire de 14 ménages pour la région de Montréal et de 16 ménages pour la région Québec est tiré et donne les données suivantes, en ce qui a trait aux dépenses pour ce secteur d’activité économique.
On suppose que les données de chaque population sont distribuées selon une loi normale.
Nous sommes intéressé à connaitre si les variances des populations sont égales.a) Faites le test d’hypothèse sur deux variances approprié au seuil de signification de 1 %. Inclure les informations suivantes :
i. Hypothèse / Identification des populationsii. Valeur(s) critique(s) de Fiii. Règle de décisioniv. Valeur du rapport Fv. Décision et conclusion
b) A partir des résultats obtenus en a), est-ce que l’hypothèse d’égalité des variances pour cette…
Chapter 2 Solutions
Essentials of Statistics for Business and Economics
Ch. 2.1 - The response to a question has three alternatives:...Ch. 2.1 - A partial relative frequency distribution is...Ch. 2.1 - A questionnaire provides 58 Yes, 42 No, and 20...Ch. 2.1 - Most Visited Websites. In a recent report, the top...Ch. 2.1 - Most Popular Last Names. In alphabetical order,...Ch. 2.1 - Top Rated Television Show Networks. Nielsen Media...Ch. 2.1 - Airline Customer Satisfaction Survey. Many...Ch. 2.1 - Data for a sample of 55 members of the Baseball...Ch. 2.1 - Degrees Awarded Annually. Nearly 1.9 million...Ch. 2.1 - Online Hotel Ratings. TripAdvisor is one of many...
Ch. 2.2 - Consider the following data. a. Develop a...Ch. 2.2 - Consider the following frequency distribution....Ch. 2.2 - Construct a histogram for the data in exercise 12....Ch. 2.2 - Consider the following data. a. Construct a dot...Ch. 2.2 - Construct a stem-and-leaf display for the...Ch. 2.2 - Construct a stem-and-leaf display for the...Ch. 2.2 - A doctor’s office staff studied the waiting times...Ch. 2.2 - NBA Total Player Ratings. CBSSports.com developed...Ch. 2.2 - Busiest North American Airports. Based on the...Ch. 2.2 - CEO Time in Meetings. The London School of...Ch. 2.2 - Largest University Endowments. University...Ch. 2.2 - Top U.S. Franchises. Entrepreneur magazine ranks...Ch. 2.2 - Engineering School Graduate Salaries. The file...Ch. 2.2 - Best Paying College Degrees. Each year America.EDU...Ch. 2.2 - Marathon Runner Ages. The Flying Pig is a marathon...Ch. 2.3 - The following data are for 30 observations...Ch. 2.3 - The following observations are for two...Ch. 2.3 - Daytona 500 Automobile Makes Average Speeds. The...Ch. 2.3 - Daytona 500 Average Speeds of Winners. The...Ch. 2.3 - Recently, management at Oak Tree Golf Course...Ch. 2.3 - Household Income Levels. The following...Ch. 2.3 - Values of World’s Most Valuable Brands. Each year...Ch. 2.3 - Revenue of World’s Most Valuable Brands. Refer to...Ch. 2.3 - Car Fuel Efficiencies. The U.S. Department of...Ch. 2.4 - The following 20 observations are for two...Ch. 2.4 - Consider the following data on two categorical...Ch. 2.4 - The following crosstabulation summarizes the data...Ch. 2.4 - Driving Speed and Fuel Efficiency. A study on...Ch. 2.4 - Low Temperatures and Snowfall. The file Snow...Ch. 2.4 - Hypertension and Heart Disease. People often wait...Ch. 2.4 - Smartphone Ownership. Consider the following...Ch. 2.4 - Store Managers Time Study. The Northwest regional...Ch. 2 - SAT Scores. The SAT is a standardized test used by...Ch. 2 - Median Household Incomes. The file MedianHousehold...Ch. 2 - State Populations. Data showing the population by...Ch. 2 - Startup Company Funds. According to the Wall...Ch. 2 - Complaints Reported to BBB. Consumer complaints...Ch. 2 - Stock Price Volatility. The term beta refers to a...Ch. 2 - Education Level and Household Income. The U.S....Ch. 2 - Western University has only one womens softball...Ch. 2 - Best Places to Work. Fortune magazine publishes an...Ch. 2 - Prob. 53SECh. 2 - Colleges’ Year Founded and Percent Graduated....Ch. 2 - Colleges’ Year Founded and Cost. Refer to the data...Ch. 2 - Colleges’ Cost and Percent Graduated. Refer to the...Ch. 2 - Electric Vehicle Sales. Electric plug-in vehicle...Ch. 2 - Zoo Member Types and Attendance. A zoo has...Ch. 2 - Pelican Stores, a division of National Clothing,...Ch. 2 - The movie industry is a competitive business. More...Ch. 2 - Cincinnati, Ohio, also known as the Queen City,...Ch. 2 - Jon Weideman, first shift foreman for Cut-Rate...
Knowledge Booster


Learn more about
Need a deep-dive on the concept behind this application? Look no further. Learn more about this topic, statistics and related others by exploring similar questions and additional content below.Similar questions
- According to an economist from a financial company, the average expenditures on "furniture and household appliances" have been lower for households in the Montreal area than those in the Quebec region. A random sample of 14 households from the Montreal region and 16 households from the Quebec region was taken, providing the following data regarding expenditures in this economic sector. It is assumed that the data from each population are distributed normally. We are interested in knowing if the variances of the populations are equal. a) Perform the appropriate hypothesis test on two variances at a significance level of 1%. Include the following information: i. Hypothesis / Identification of populations ii. Critical F-value(s) iii. Decision rule iv. F-ratio value v. Decision and conclusion b) Based on the results obtained in a), is the hypothesis of equal variances for this socio-economic characteristic measured in these two populations upheld? c) Based on the results obtained in a),…arrow_forwardA major company in the Montreal area, offering a range of engineering services from project preparation to construction execution, and industrial project management, wants to ensure that the individuals who are responsible for project cost estimation and bid preparation demonstrate a certain uniformity in their estimates. The head of civil engineering and municipal services decided to structure an experimental plan to detect if there could be significant differences in project evaluation. Seven projects were selected, each of which had to be evaluated by each of the two estimators, with the order of the projects submitted being random. The obtained estimates are presented in the table below. a) Complete the table above by calculating: i. The differences (A-B) ii. The sum of the differences iii. The mean of the differences iv. The standard deviation of the differences b) What is the value of the t-statistic? c) What is the critical t-value for this test at a significance level of 1%?…arrow_forwardCompute the relative risk of falling for the two groups (did not stop walking vs. did stop). State/interpret your result verbally.arrow_forward
- Microsoft Excel include formulasarrow_forwardQuestion 1 The data shown in Table 1 are and R values for 24 samples of size n = 5 taken from a process producing bearings. The measurements are made on the inside diameter of the bearing, with only the last three decimals recorded (i.e., 34.5 should be 0.50345). Table 1: Bearing Diameter Data Sample Number I R Sample Number I R 1 34.5 3 13 35.4 8 2 34.2 4 14 34.0 6 3 31.6 4 15 37.1 5 4 31.5 4 16 34.9 7 5 35.0 5 17 33.5 4 6 34.1 6 18 31.7 3 7 32.6 4 19 34.0 8 8 33.8 3 20 35.1 9 34.8 7 21 33.7 2 10 33.6 8 22 32.8 1 11 31.9 3 23 33.5 3 12 38.6 9 24 34.2 2 (a) Set up and R charts on this process. Does the process seem to be in statistical control? If necessary, revise the trial control limits. [15 pts] (b) If specifications on this diameter are 0.5030±0.0010, find the percentage of nonconforming bearings pro- duced by this process. Assume that diameter is normally distributed. [10 pts] 1arrow_forward4. (5 pts) Conduct a chi-square contingency test (test of independence) to assess whether there is an association between the behavior of the elderly person (did not stop to talk, did stop to talk) and their likelihood of falling. Below, please state your null and alternative hypotheses, calculate your expected values and write them in the table, compute the test statistic, test the null by comparing your test statistic to the critical value in Table A (p. 713-714) of your textbook and/or estimating the P-value, and provide your conclusions in written form. Make sure to show your work. Did not stop walking to talk Stopped walking to talk Suffered a fall 12 11 Totals 23 Did not suffer a fall | 2 Totals 35 37 14 46 60 Tarrow_forward
- Question 2 Parts manufactured by an injection molding process are subjected to a compressive strength test. Twenty samples of five parts each are collected, and the compressive strengths (in psi) are shown in Table 2. Table 2: Strength Data for Question 2 Sample Number x1 x2 23 x4 x5 R 1 83.0 2 88.6 78.3 78.8 3 85.7 75.8 84.3 81.2 78.7 75.7 77.0 71.0 84.2 81.0 79.1 7.3 80.2 17.6 75.2 80.4 10.4 4 80.8 74.4 82.5 74.1 75.7 77.5 8.4 5 83.4 78.4 82.6 78.2 78.9 80.3 5.2 File Preview 6 75.3 79.9 87.3 89.7 81.8 82.8 14.5 7 74.5 78.0 80.8 73.4 79.7 77.3 7.4 8 79.2 84.4 81.5 86.0 74.5 81.1 11.4 9 80.5 86.2 76.2 64.1 80.2 81.4 9.9 10 75.7 75.2 71.1 82.1 74.3 75.7 10.9 11 80.0 81.5 78.4 73.8 78.1 78.4 7.7 12 80.6 81.8 79.3 73.8 81.7 79.4 8.0 13 82.7 81.3 79.1 82.0 79.5 80.9 3.6 14 79.2 74.9 78.6 77.7 75.3 77.1 4.3 15 85.5 82.1 82.8 73.4 71.7 79.1 13.8 16 78.8 79.6 80.2 79.1 80.8 79.7 2.0 17 82.1 78.2 18 84.5 76.9 75.5 83.5 81.2 19 79.0 77.8 20 84.5 73.1 78.2 82.1 79.2 81.1 7.6 81.2 84.4 81.6 80.8…arrow_forwardName: Lab Time: Quiz 7 & 8 (Take Home) - due Wednesday, Feb. 26 Contingency Analysis (Ch. 9) In lab 5, part 3, you will create a mosaic plot and conducted a chi-square contingency test to evaluate whether elderly patients who did not stop walking to talk (vs. those who did stop) were more likely to suffer a fall in the next six months. I have tabulated the data below. Answer the questions below. Please show your calculations on this or a separate sheet. Did not stop walking to talk Stopped walking to talk Totals Suffered a fall Did not suffer a fall Totals 12 11 23 2 35 37 14 14 46 60 Quiz 7: 1. (2 pts) Compute the odds of falling for each group. Compute the odds ratio for those who did not stop walking vs. those who did stop walking. Interpret your result verbally.arrow_forwardSolve please and thank you!arrow_forward
- 7. In a 2011 article, M. Radelet and G. Pierce reported a logistic prediction equation for the death penalty verdicts in North Carolina. Let Y denote whether a subject convicted of murder received the death penalty (1=yes), for the defendant's race h (h1, black; h = 2, white), victim's race i (i = 1, black; i = 2, white), and number of additional factors j (j = 0, 1, 2). For the model logit[P(Y = 1)] = a + ß₁₂ + By + B²², they reported = -5.26, D â BD = 0, BD = 0.17, BY = 0, BY = 0.91, B = 0, B = 2.02, B = 3.98. (a) Estimate the probability of receiving the death penalty for the group most likely to receive it. [4 pts] (b) If, instead, parameters used constraints 3D = BY = 35 = 0, report the esti- mates. [3 pts] h (c) If, instead, parameters used constraints Σ₁ = Σ₁ BY = Σ; B = 0, report the estimates. [3 pts] Hint the probabilities, odds and odds ratios do not change with constraints.arrow_forwardSolve please and thank you!arrow_forwardSolve please and thank you!arrow_forward
arrow_back_ios
SEE MORE QUESTIONS
arrow_forward_ios
Recommended textbooks for you
 Functions and Change: A Modeling Approach to Coll...AlgebraISBN:9781337111348Author:Bruce Crauder, Benny Evans, Alan NoellPublisher:Cengage Learning
 Holt Mcdougal Larson Pre-algebra: Student Edition...AlgebraISBN:9780547587776Author:HOLT MCDOUGALPublisher:HOLT MCDOUGAL
 Glencoe Algebra 1, Student Edition, 9780079039897...AlgebraISBN:9780079039897Author:CarterPublisher:McGraw Hill
 Big Ideas Math A Bridge To Success Algebra 1: Stu...AlgebraISBN:9781680331141Author:HOUGHTON MIFFLIN HARCOURTPublisher:Houghton Mifflin Harcourt
 Trigonometry (MindTap Course List)TrigonometryISBN:9781337278461Author:Ron LarsonPublisher:Cengage Learning
Functions and Change: A Modeling Approach to Coll...
Algebra
ISBN:9781337111348
Author:Bruce Crauder, Benny Evans, Alan Noell
Publisher:Cengage Learning
Holt Mcdougal Larson Pre-algebra: Student Edition...
Algebra
ISBN:9780547587776
Author:HOLT MCDOUGAL
Publisher:HOLT MCDOUGAL
Glencoe Algebra 1, Student Edition, 9780079039897...
Algebra
ISBN:9780079039897
Author:Carter
Publisher:McGraw Hill
Big Ideas Math A Bridge To Success Algebra 1: Stu...
Algebra
ISBN:9781680331141
Author:HOUGHTON MIFFLIN HARCOURT
Publisher:Houghton Mifflin Harcourt
Trigonometry (MindTap Course List)
Trigonometry
ISBN:9781337278461
Author:Ron Larson
Publisher:Cengage Learning
Which is the best chart: Selecting among 14 types of charts Part II; Author: 365 Data Science;https://www.youtube.com/watch?v=qGaIB-bRn-A;License: Standard YouTube License, CC-BY