
Elementary Statistics Books a la carte Plus NEW MyLab Statistics with Pearson eText - Access Card Package (6th Edition)
6th Edition
ISBN: 9780133876239
Author: Ron Larson, Betsy Farber
Publisher: PEARSON
expand_more
expand_more
format_list_bulleted
Concept explainers
Videos
Textbook Question
Chapter 2.3, Problem 65E
Data Analysis Students in an experimental psychology class did research on depression as a sign of stress. A test was administered to a sample of 30 students. The scores are shown in the table at the left.
- (a) Find the
mean and themedian of the data. - (b) Draw a stem-and-leaf plot for the data using one row per stem. Locate the mean and the median on the display.
- (c) Describe the shape of the distribution.
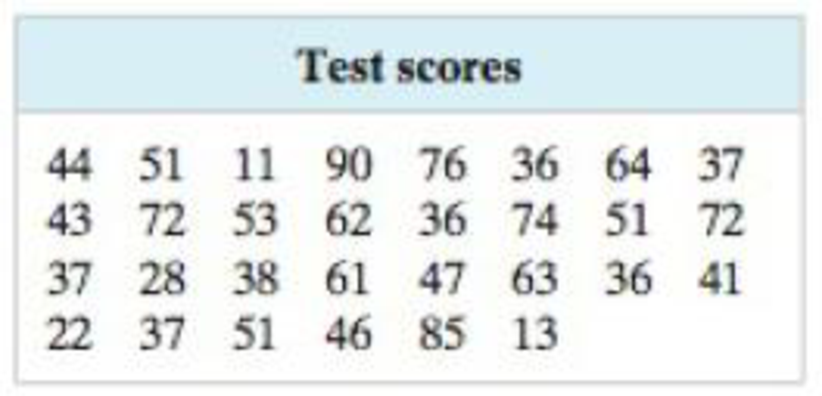
TABLE FOR EXERCISE 65
Expert Solution & Answer
Want to see the full answer?
Check out a sample textbook solution
Students have asked these similar questions
Examine the Variables: Carefully review and note the names of all variables in the dataset. Examples of these variables include:
Mileage (mpg)
Number of Cylinders (cyl)
Displacement (disp)
Horsepower (hp)
Research: Google to understand these variables.
Statistical Analysis: Select mpg variable, and perform the following statistical tests. Once you are done with these tests using mpg variable, repeat the same with hp
Mean
Median
First Quartile (Q1)
Second Quartile (Q2)
Third Quartile (Q3)
Fourth Quartile (Q4)
10th Percentile
70th Percentile
Skewness
Kurtosis
Document Your Results:
In RStudio: Before running each statistical test, provide a heading in the format shown at the bottom. “# Mean of mileage – Your name’s command”
In Microsoft Word: Once you've completed all tests, take a screenshot of your results in RStudio and paste it into a Microsoft Word document. Make sure that snapshots are very clear. You will need multiple snapshots. Also transfer these results to the…
2 (VaR and ES) Suppose X1
are independent. Prove that
~
Unif[-0.5, 0.5] and X2
VaRa (X1X2) < VaRa(X1) + VaRa (X2).
~
Unif[-0.5, 0.5]
Chapter 2 Solutions
Elementary Statistics Books a la carte Plus NEW MyLab Statistics with Pearson eText - Access Card Package (6th Edition)
Ch. 2.1 - Prob. 1TYCh. 2.1 - Prob. 2TYCh. 2.1 - Prob. 3TYCh. 2.1 - Prob. 4TYCh. 2.1 - Prob. 5TYCh. 2.1 - Prob. 6TYCh. 2.1 - Prob. 7TYCh. 2.1 - What are some benefits of representing data sets...Ch. 2.1 - Why should the number of classes in a frequency...Ch. 2.1 - What is the difference between class limits and...
Ch. 2.1 - What is the difference between relative frequency...Ch. 2.1 - After constructing an expanded frequency...Ch. 2.1 - What is the difference between a frequency polygon...Ch. 2.1 - True or False? In Exercises 710, determine whether...Ch. 2.1 - True or False? In Exercises 710, determine whether...Ch. 2.1 - True or False? In Exercises 710, determine whether...Ch. 2.1 - Prob. 10ECh. 2.1 - In Exercises 1114, use the minimum and maximum...Ch. 2.1 - In Exercises 1114, use the minimum and maximum...Ch. 2.1 - In Exercises 1114, use the minimum and maximum...Ch. 2.1 - In Exercises 1114, use the minimum and maximum...Ch. 2.1 - Reading a Frequency Distribution In Exercises 15...Ch. 2.1 - Prob. 15ECh. 2.1 - Prob. 17ECh. 2.1 - Prob. 18ECh. 2.1 - Prob. 19ECh. 2.1 - Prob. 20ECh. 2.1 - Prob. 21ECh. 2.1 - Prob. 22ECh. 2.1 - Prob. 23ECh. 2.1 - Prob. 24ECh. 2.1 - Prob. 25ECh. 2.1 - Prob. 26ECh. 2.1 - Prob. 27ECh. 2.1 - Prob. 28ECh. 2.1 - Prob. 29ECh. 2.1 - Prob. 30ECh. 2.1 - Prob. 31ECh. 2.1 - Constructing a Frequency Distribution and a...Ch. 2.1 - Constructing a Frequency Distribution and a...Ch. 2.1 - Prob. 34ECh. 2.1 - Prob. 35ECh. 2.1 - Prob. 36ECh. 2.1 - Prob. 37ECh. 2.1 - Prob. 38ECh. 2.1 - Prob. 39ECh. 2.1 - Prob. 40ECh. 2.1 - Prob. 41ECh. 2.1 - Prob. 42ECh. 2.1 - In Exercises 43 and 44, use the data set and the...Ch. 2.1 - Prob. 44ECh. 2.1 - What Would You Do? You work at a bank and are...Ch. 2.1 - Prob. 46ECh. 2.1 - Prob. 47ECh. 2.2 - Prob. 1TYCh. 2.2 - Prob. 2TYCh. 2.2 - Prob. 3TYCh. 2.2 - Prob. 4TYCh. 2.2 - Prob. 5TYCh. 2.2 - Prob. 6TYCh. 2.2 - Prob. 7TYCh. 2.2 - Name some ways to display quantitative data...Ch. 2.2 - What is an advantage of using a stem-and-leaf plot...Ch. 2.2 - In terms of displaying data, how is a...Ch. 2.2 - How is a Pareto chart different from a standard...Ch. 2.2 - Putting Graphs in Context In Exercises 58, match...Ch. 2.2 - Putting Graphs in Context In Exercises 58, match...Ch. 2.2 - Putting Graphs in Context In Exercises 58, match...Ch. 2.2 - Putting Graphs in Context In Exercises 58, match...Ch. 2.2 - Graphical Analysis In Exercises 912, use the...Ch. 2.2 - Graphical Analysis In Exercises 912, use the...Ch. 2.2 - Graphical Analysis In Exercises 912, use the...Ch. 2.2 - Prob. 12ECh. 2.2 - Prob. 13ECh. 2.2 - Prob. 14ECh. 2.2 - Prob. 15ECh. 2.2 - Prob. 16ECh. 2.2 - Graphing Data Sets In Exercises 1732, organize the...Ch. 2.2 - Graphing Data Sets In Exercises 1732, organize the...Ch. 2.2 - Prob. 19ECh. 2.2 - Prob. 20ECh. 2.2 - Prob. 21ECh. 2.2 - Prob. 22ECh. 2.2 - Prob. 23ECh. 2.2 - Graphing Data Sets In Exercises 1732, organize the...Ch. 2.2 - Prob. 25ECh. 2.2 - Prob. 26ECh. 2.2 - Prob. 27ECh. 2.2 - Prob. 28ECh. 2.2 - Hourly Wages Use a scatter plot to display the...Ch. 2.2 - Salaries Use a scatter plot to display the data...Ch. 2.2 - Prob. 31ECh. 2.2 - Prob. 32ECh. 2.2 - Prob. 33ECh. 2.2 - Prob. 34ECh. 2.2 - Prob. 35ECh. 2.2 - Favorite Day of the Week Display the data below in...Ch. 2.2 - A Misleading Graph? A misleading graph is not...Ch. 2.2 - Prob. 38ECh. 2.2 - A Misleading Graph? A misleading graph is not...Ch. 2.2 - Prob. 40ECh. 2.2 - Prob. 41ECh. 2.2 - Prob. 42ECh. 2.3 - Find the mean of the points scored by the 51...Ch. 2.3 - Find the median of the points scored by the 51...Ch. 2.3 - The points scored by the winning teams in the...Ch. 2.3 - Find the mode of the points scored by the 51...Ch. 2.3 - In a survey, 1534 adults were asked, How much do...Ch. 2.3 - Remove the data entry 65 from the data set in...Ch. 2.3 - In Example 7, your grade in the two-credit course...Ch. 2.3 - Use a frequency distribution to estimate the mean...Ch. 2.3 - True or False? In Exercises 14, determine whether...Ch. 2.3 - True or False? In Exercises 14, determine whether...Ch. 2.3 - True or False? In Exercises 14, determine whether...Ch. 2.3 - True or False? In Exercises 14, determine whether...Ch. 2.3 - Constructing Data Sets In Exercises 58, construct...Ch. 2.3 - Constructing Data Sets In Exercises 58, construct...Ch. 2.3 - Mean is not representative of a typical number in...Ch. 2.3 - Prob. 8ECh. 2.3 - Graphical Analysis In Exercises 912, determine...Ch. 2.3 - Graphical Analysis In Exercises 912, determine...Ch. 2.3 - Graphical Analysis In Exercises 912, determine...Ch. 2.3 - Graphical Analysis In Exercises 912, determine...Ch. 2.3 - Graphical Analysis In Exercises 912, determine...Ch. 2.3 - Prob. 14ECh. 2.3 - Graphical Analysis In Exercises 912, determine...Ch. 2.3 - Graphical Analysis In Exercises 912, determine...Ch. 2.3 - Prob. 17ECh. 2.3 - Finding and Discussing the Mean, Median, and Mode...Ch. 2.3 - Prob. 19ECh. 2.3 - Prob. 20ECh. 2.3 - Prob. 21ECh. 2.3 - Finding and Discussing the Mean, Median, and Mode...Ch. 2.3 - Prob. 23ECh. 2.3 - Prob. 24ECh. 2.3 - Prob. 25ECh. 2.3 - Finding and Discussing the Mean, Median, and Mode...Ch. 2.3 - Finding and Discussing the Mean, Median, and Mode...Ch. 2.3 - Prob. 28ECh. 2.3 - Prob. 29ECh. 2.3 - Finding and Discussing the Mean, Median, and Mode...Ch. 2.3 - Prob. 31ECh. 2.3 - Finding and Discussing the Mean, Median, and Mode...Ch. 2.3 - Finding and Discussing the Mean, Median, and Mode...Ch. 2.3 - Prob. 34ECh. 2.3 - Prob. 35ECh. 2.3 - Prob. 36ECh. 2.3 - Prob. 37ECh. 2.3 - In Exercises 3740, without performing any...Ch. 2.3 - In Exercises 3740, without performing any...Ch. 2.3 - In Exercises 3740, without performing any...Ch. 2.3 - Prob. 41ECh. 2.3 - Prob. 42ECh. 2.3 - Finding a Weighted Mean In Exercises 4146, find...Ch. 2.3 - Prob. 44ECh. 2.3 - Prob. 45ECh. 2.3 - Prob. 46ECh. 2.3 - Prob. 47ECh. 2.3 - Prob. 48ECh. 2.3 - Prob. 49ECh. 2.3 - Prob. 50ECh. 2.3 - Prob. 51ECh. 2.3 - Prob. 52ECh. 2.3 - Prob. 53ECh. 2.3 - Prob. 54ECh. 2.3 - Identifying the Shape of a Distribution In...Ch. 2.3 - Identifying the Shape of a Distribution In...Ch. 2.3 - Prob. 57ECh. 2.3 - Prob. 58ECh. 2.3 - Prob. 59ECh. 2.3 - Prob. 60ECh. 2.3 - Prob. 61ECh. 2.3 - Prob. 62ECh. 2.3 - Prob. 63ECh. 2.3 - Prob. 64ECh. 2.3 - Data Analysis Students in an experimental...Ch. 2.3 - Trimmed Mean To find the 10% trimmed mean of a...Ch. 2.3 - Specify the lower limit to be 1 and the upper...Ch. 2.3 - Specify the lower limit to be 0 and the upper...Ch. 2.4 - Prob. 1TYCh. 2.4 - Prob. 2TYCh. 2.4 - Prob. 3TYCh. 2.4 - Prob. 4TYCh. 2.4 - Prob. 5TYCh. 2.4 - Prob. 6TYCh. 2.4 - Prob. 7TYCh. 2.4 - Prob. 8TYCh. 2.4 - Prob. 9TYCh. 2.4 - Prob. 10TYCh. 2.4 - Explain how to find the range of a data set. What...Ch. 2.4 - Explain how to find the deviation of an entry in a...Ch. 2.4 - Why is the standard deviation used more frequently...Ch. 2.4 - Explain the relationship between variance and...Ch. 2.4 - Describe the difference between the calculation of...Ch. 2.4 - Given a data set. how do you know whether to...Ch. 2.4 - Discuss the similarities and the differences...Ch. 2.4 - What must you know about a data set before you can...Ch. 2.4 - Prob. 9ECh. 2.4 - Finding the Range of a Data Set In Exercises 9 and...Ch. 2.4 - Archaeology The depths (in inches) at which 10...Ch. 2.4 - In Exercise 11, compare your answer to part (a)...Ch. 2.4 - Prob. 13ECh. 2.4 - Prob. 14ECh. 2.4 - Prob. 15ECh. 2.4 - Prob. 16ECh. 2.4 - Estimating Standard Deviation Both data sets shown...Ch. 2.4 - Estimating Standard Deviation Both data sets shown...Ch. 2.4 - Prob. 19ECh. 2.4 - Prob. 20ECh. 2.4 - Prob. 21ECh. 2.4 - Prob. 22ECh. 2.4 - Prob. 23ECh. 2.4 - Prob. 24ECh. 2.4 - Constructing Data Sets In Exercises 2528,...Ch. 2.4 - Constructing Data Sets In Exercises 2528,...Ch. 2.4 - Constructing Data Sets In Exercises 2528,...Ch. 2.4 - Constructing Data Sets In Exercises 2528,...Ch. 2.4 - Using the Empirical Rule In Exercises 2934, use...Ch. 2.4 - Using the Empirical Rule In Exercises 2934, use...Ch. 2.4 - Using the Empirical Rule In Exercises 2934, use...Ch. 2.4 - Using the Empirical Rule In Exercises 2934, use...Ch. 2.4 - Using the Empirical Rule In Exercises 2934, use...Ch. 2.4 - Using the Empirical Rule In Exercises 2934, use...Ch. 2.4 - Using Chebychevs Theorem You are conducting a...Ch. 2.4 - Prob. 36ECh. 2.4 - Prob. 37ECh. 2.4 - Prob. 38ECh. 2.4 - Prob. 39ECh. 2.4 - Estimating the Sample Mean and Standard Deviation...Ch. 2.4 - Estimating the Sample Mean and Standard Deviation...Ch. 2.4 - Prob. 42ECh. 2.4 - Prob. 43ECh. 2.4 - Prob. 44ECh. 2.4 - Prob. 45ECh. 2.4 - Prob. 46ECh. 2.4 - Prob. 47ECh. 2.4 - Prob. 48ECh. 2.4 - Prob. 49ECh. 2.4 - Prob. 50ECh. 2.4 - Prob. 51ECh. 2.4 - Prob. 52ECh. 2.4 - Prob. 53ECh. 2.4 - Prob. 54ECh. 2.4 - Specify the lower limit to be 10 and the upper...Ch. 2.4 - Specify the lower limit to be 30 and the upper...Ch. 2.4 - Prob. 1CSCh. 2.4 - Prob. 2CSCh. 2.4 - Prob. 3CSCh. 2.4 - Prob. 4CSCh. 2.4 - Prob. 5CSCh. 2.4 - Prob. 6CSCh. 2.5 - Prob. 1TYCh. 2.5 - Prob. 2TYCh. 2.5 - Prob. 3TYCh. 2.5 - Prob. 4TYCh. 2.5 - Prob. 5TYCh. 2.5 - Prob. 6TYCh. 2.5 - Prob. 7TYCh. 2.5 - Prob. 8TYCh. 2.5 - Prob. 1ECh. 2.5 - Prob. 2ECh. 2.5 - Prob. 3ECh. 2.5 - Prob. 4ECh. 2.5 - Explain how to identify outliers using the...Ch. 2.5 - Describe the relationship between quartiles and...Ch. 2.5 - True or False? In Exercises 710, determine whether...Ch. 2.5 - True or False? In Exercises 710, determine whether...Ch. 2.5 - True or False? In Exercises 710, determine whether...Ch. 2.5 - True or False? In Exercises 710, determine whether...Ch. 2.5 - Finding Quartiles, Interquartile Range, and...Ch. 2.5 - Prob. 12ECh. 2.5 - Prob. 13ECh. 2.5 - Prob. 14ECh. 2.5 - Prob. 15ECh. 2.5 - Prob. 16ECh. 2.5 - Drawing a Box-and-Whisker Plot In Exercises 1518,...Ch. 2.5 - Drawing a Box-and-Whisker Plot In Exercises 1518,...Ch. 2.5 - Drawing a Box-and-Whisker Plot In Exercises 1518,...Ch. 2.5 - Prob. 20ECh. 2.5 - Graphical Analysis In Exercises 1922, use the...Ch. 2.5 - Graphical Analysis In Exercises 1922, use the...Ch. 2.5 - Graphical Analysis In Exercises 1922, use the...Ch. 2.5 - Graphical Analysis In Exercises 1922, use the...Ch. 2.5 - Prob. 25ECh. 2.5 - Using Technology to Find Quartiles and Draw Graphs...Ch. 2.5 - Prob. 27ECh. 2.5 - Prob. 28ECh. 2.5 - Prob. 29ECh. 2.5 - Prob. 30ECh. 2.5 - Prob. 31ECh. 2.5 - Prob. 32ECh. 2.5 - Prob. 33ECh. 2.5 - Prob. 34ECh. 2.5 - Finding a Percentile In Exercises 3336, use the...Ch. 2.5 - Finding a Percentile In Exercises 3336, use the...Ch. 2.5 - Finding a Percentile In Exercises 3336, use the...Ch. 2.5 - Finding a Percentile In Exercises 3336, use the...Ch. 2.5 - Prob. 39ECh. 2.5 - Prob. 40ECh. 2.5 - Prob. 41ECh. 2.5 - Prob. 42ECh. 2.5 - Prob. 43ECh. 2.5 - Prob. 44ECh. 2.5 - Prob. 45ECh. 2.5 - Prob. 46ECh. 2.5 - Life Spans of Tires A brand of automobile tire has...Ch. 2.5 - Life Spans of Fruit Flies The life spans of a...Ch. 2.5 - Prob. 49ECh. 2.5 - Prob. 50ECh. 2.5 - Prob. 51ECh. 2.5 - Prob. 52ECh. 2.5 - Prob. 53ECh. 2.5 - Prob. 54ECh. 2.5 - Song Lengths Side-by-side box-and-whisker plots...Ch. 2.5 - Credit Card Purchases The credit card purchases...Ch. 2.5 - Modified Box-and-Whisker Plot In Exercises 5962,...Ch. 2.5 - Modified Box-and-Whisker Plot In Exercises 5962,...Ch. 2 - Prob. 2.1.1RECh. 2 - Prob. 2.1.2RECh. 2 - Prob. 2.1.3RECh. 2 - Prob. 2.1.4RECh. 2 - Prob. 2.1.5RECh. 2 - Prob. 2.1.6RECh. 2 - Prob. 2.2.7RECh. 2 - Prob. 2.2.8RECh. 2 - Prob. 2.2.9RECh. 2 - Prob. 2.2.10RECh. 2 - Prob. 2.2.11RECh. 2 - Prob. 2.2.12RECh. 2 - Prob. 2.3.13RECh. 2 - Prob. 2.3.14RECh. 2 - For the six test scores 78, 72, 86, 91, 87, and...Ch. 2 - For the four test scores 96, 85, 91, and 86, the...Ch. 2 - Estimate the mean of the frequency distribution...Ch. 2 - The frequency distribution shows the numbers of...Ch. 2 - Prob. 2.3.19RECh. 2 - Prob. 2.3.20RECh. 2 - In Exercises 21 and 22, determine whether the...Ch. 2 - In Exercises 21 and 22, determine whether the...Ch. 2 - Prob. 2.3.23RECh. 2 - For the histogram in Exercise 21, which is...Ch. 2 - In Exercises 25 and 26, find the range, mean,...Ch. 2 - Prob. 2.4.26RECh. 2 - Prob. 2.4.27RECh. 2 - Prob. 2.4.28RECh. 2 - Prob. 2.4.29RECh. 2 - Prob. 2.4.30RECh. 2 - Prob. 2.4.31RECh. 2 - Prob. 2.4.32RECh. 2 - From a random sample of households, the numbers of...Ch. 2 - From a random sample of airplanes, the numbers of...Ch. 2 - In Exercises 35 and 36, find the coefficient of...Ch. 2 - Prob. 2.4.36RECh. 2 - Prob. 2.5.37RECh. 2 - Prob. 2.5.38RECh. 2 - Prob. 2.5.39RECh. 2 - Prob. 2.5.40RECh. 2 - Prob. 2.5.41RECh. 2 - Prob. 2.5.42RECh. 2 - A students test grade of 75 represents the 65th...Ch. 2 - Prob. 2.5.44RECh. 2 - Prob. 2.5.45RECh. 2 - Prob. 2.5.46RECh. 2 - Prob. 2.5.47RECh. 2 - Prob. 2.5.48RECh. 2 - Prob. 1CQCh. 2 - Prob. 2CQCh. 2 - Prob. 3CQCh. 2 - Prob. 4CQCh. 2 - Prob. 5CQCh. 2 - Prob. 6CQCh. 2 - Prob. 7CQCh. 2 - Prob. 1CTCh. 2 - Prob. 2CTCh. 2 - Prob. 3CTCh. 2 - Prob. 4CTCh. 2 - Prob. 5CTCh. 2 - Prob. 6CTCh. 2 - Prob. 7CTCh. 2 - Prob. 8CTCh. 2 - Prob. 1RSRDCh. 2 - Prob. 2RSRDCh. 2 - Prob. 3RSRDCh. 2 - Prob. 1TCh. 2 - Prob. 2TCh. 2 - Prob. 3TCh. 2 - Prob. 4TCh. 2 - Prob. 5TCh. 2 - Prob. 6TCh. 2 - Prob. 7TCh. 2 - Prob. 8TCh. 2 - Prob. 9TCh. 2 - Prob. 10TCh. 2 - In Exercices 1 and 2, identify the sampling...Ch. 2 - Prob. 2CRCh. 2 - Prob. 3CRCh. 2 - Prob. 4CRCh. 2 - Prob. 5CRCh. 2 - Prob. 6CRCh. 2 - Prob. 7CRCh. 2 - Prob. 8CRCh. 2 - Prob. 9CRCh. 2 - Prob. 10CRCh. 2 - Prob. 11CRCh. 2 - Prob. 12CRCh. 2 - Prob. 13CRCh. 2 - Prob. 14CRCh. 2 - Tail lengths (in feet) for a sample of American...Ch. 2 - Prob. 16CRCh. 2 - Prob. 17CRCh. 2 - Prob. 18CRCh. 2 - Prob. 19CR
Knowledge Booster


Learn more about
Need a deep-dive on the concept behind this application? Look no further. Learn more about this topic, statistics and related others by exploring similar questions and additional content below.Similar questions
- 8 (Correlation and Diversification) Assume we have two stocks, A and B, show that a particular combination of the two stocks produce a risk-free portfolio when the correlation between the return of A and B is -1.arrow_forward9 (Portfolio allocation) Suppose R₁ and R2 are returns of 2 assets and with expected return and variance respectively r₁ and 72 and variance-covariance σ2, 0%½ and σ12. Find −∞ ≤ w ≤ ∞ such that the portfolio wR₁ + (1 - w) R₂ has the smallest risk.arrow_forward7 (Multivariate random variable) Suppose X, €1, €2, €3 are IID N(0, 1) and Y2 Y₁ = 0.2 0.8X + €1, Y₂ = 0.3 +0.7X+ €2, Y3 = 0.2 + 0.9X + €3. = (In models like this, X is called the common factors of Y₁, Y₂, Y3.) Y = (Y1, Y2, Y3). (a) Find E(Y) and cov(Y). (b) What can you observe from cov(Y). Writearrow_forward
- 1 (VaR and ES) Suppose X ~ f(x) with 1+x, if 0> x > −1 f(x) = 1−x if 1 x > 0 Find VaRo.05 (X) and ES0.05 (X).arrow_forwardJoy is making Christmas gifts. She has 6 1/12 feet of yarn and will need 4 1/4 to complete our project. How much yarn will she have left over compute this solution in two different ways arrow_forwardSolve for X. Explain each step. 2^2x • 2^-4=8arrow_forward
- One hundred people were surveyed, and one question pertained to their educational background. The results of this question and their genders are given in the following table. Female (F) Male (F′) Total College degree (D) 30 20 50 No college degree (D′) 30 20 50 Total 60 40 100 If a person is selected at random from those surveyed, find the probability of each of the following events.1. The person is female or has a college degree. Answer: equation editor Equation Editor 2. The person is male or does not have a college degree. Answer: equation editor Equation Editor 3. The person is female or does not have a college degree.arrow_forwardneed help with part barrow_forwardSuppose you know that Bob's test score is above the mean, but he doesn't remember by how much. At least how many students must score lower than Bob?arrow_forward
- If a baby's weight is at the median, what's her percentile?arrow_forwardAt the same restaurant as in Question 19 with the same normal distribution, what's the chance of it taking no more than 15 minutes to get service?arrow_forwardClint, obviously not in college, sleeps an average of 8 hours per night with a standard deviation of 15 minutes. What's the chance of him sleeping between 7.5 and 8.5 hours on any given night? 0-(7-0) 200 91109s and doiw $20 (8-0) mol 8520 slang $199 galbrog seam side pide & D (newid se od poyesvig as PELEO PER AFTE editiw noudab temand van Czarrow_forward
arrow_back_ios
SEE MORE QUESTIONS
arrow_forward_ios
Recommended textbooks for you
 Glencoe Algebra 1, Student Edition, 9780079039897...AlgebraISBN:9780079039897Author:CarterPublisher:McGraw Hill
 Big Ideas Math A Bridge To Success Algebra 1: Stu...AlgebraISBN:9781680331141Author:HOUGHTON MIFFLIN HARCOURTPublisher:Houghton Mifflin Harcourt
 Holt Mcdougal Larson Pre-algebra: Student Edition...AlgebraISBN:9780547587776Author:HOLT MCDOUGALPublisher:HOLT MCDOUGAL
Glencoe Algebra 1, Student Edition, 9780079039897...
Algebra
ISBN:9780079039897
Author:Carter
Publisher:McGraw Hill
Big Ideas Math A Bridge To Success Algebra 1: Stu...
Algebra
ISBN:9781680331141
Author:HOUGHTON MIFFLIN HARCOURT
Publisher:Houghton Mifflin Harcourt
Holt Mcdougal Larson Pre-algebra: Student Edition...
Algebra
ISBN:9780547587776
Author:HOLT MCDOUGAL
Publisher:HOLT MCDOUGAL
Continuous Probability Distributions - Basic Introduction; Author: The Organic Chemistry Tutor;https://www.youtube.com/watch?v=QxqxdQ_g2uw;License: Standard YouTube License, CC-BY
Probability Density Function (p.d.f.) Finding k (Part 1) | ExamSolutions; Author: ExamSolutions;https://www.youtube.com/watch?v=RsuS2ehsTDM;License: Standard YouTube License, CC-BY
Find the value of k so that the Function is a Probability Density Function; Author: The Math Sorcerer;https://www.youtube.com/watch?v=QqoCZWrVnbA;License: Standard Youtube License