
Elementary Statistics Books a la carte Plus NEW MyLab Statistics with Pearson eText - Access Card Package (6th Edition)
6th Edition
ISBN: 9780133876239
Author: Ron Larson, Betsy Farber
Publisher: PEARSON
expand_more
expand_more
format_list_bulleted
Videos
Textbook Question
Chapter 2.3, Problem 55E
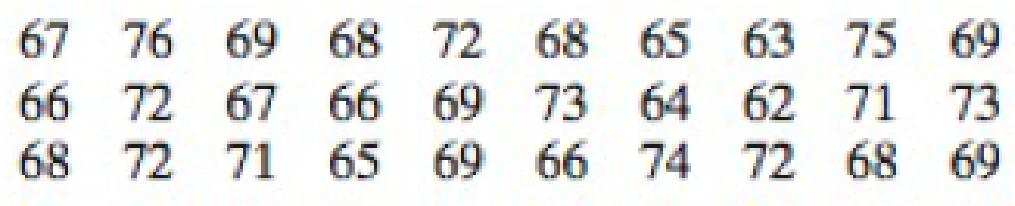
Identifying the Shape of a Distribution In Exercises 53–56, construct a frequency distribution and a frequency histogram for the data set using the indicated number of classes. Describe the shape of the histogram as symmetric, uniform, negatively skewed, positively skewed, or none of these.
55. Heights of Males
Number of classes: 5
Data set: The heights (to the nearest inch) of 30 males
Expert Solution & Answer
Want to see the full answer?
Check out a sample textbook solution
Students have asked these similar questions
https://www.hawkeslearning.com/Statistics/dbs2/datasets.html
NC Current Students - North Ce X | NC Canvas Login Links - North ( X
Final Exam Comprehensive x Cengage Learning
x
WASTAT - Final Exam - STAT
→
C
webassign.net/web/Student/Assignment-Responses/submit?dep=36055360&tags=autosave#question3659890_9
Part (b)
Draw a scatter plot of the ordered pairs.
N
Life
Expectancy
Life
Expectancy
80
70
600
50
40
30
20
10
Year of
1950
1970 1990
2010 Birth
O
Life
Expectancy
Part (c)
800
70
60
50
40
30
20
10
1950
1970 1990
W
ALT
林
$
#
4
R
J7
Year of
2010 Birth
F6
4+
80
70
60
50
40
30
20
10
Year of
1950 1970 1990
2010 Birth
Life
Expectancy
Ox
800
70
60
50
40
30
20
10
Year of
1950 1970 1990 2010 Birth
hp
P.B.
KA
&
7
80
% 5
H
A
B
F10
711
N
M
K
744
PRT SC
ALT
CTRL
Harvard University
California Institute of Technology
Massachusetts Institute of Technology
Stanford University
Princeton University
University of Cambridge
University of Oxford
University of California, Berkeley
Imperial College London
Yale University
University of California, Los Angeles
University of Chicago
Johns Hopkins University
Cornell University
ETH Zurich
University of Michigan
University of Toronto
Columbia University
University of Pennsylvania
Carnegie Mellon University
University of Hong Kong
University College London
University of Washington
Duke University
Northwestern University
University of Tokyo
Georgia Institute of Technology
Pohang University of Science and Technology
University of California, Santa Barbara
University of British Columbia
University of North Carolina at Chapel Hill
University of California, San Diego
University of Illinois at Urbana-Champaign
National University of Singapore
McGill…
Chapter 2 Solutions
Elementary Statistics Books a la carte Plus NEW MyLab Statistics with Pearson eText - Access Card Package (6th Edition)
Ch. 2.1 - Prob. 1TYCh. 2.1 - Prob. 2TYCh. 2.1 - Prob. 3TYCh. 2.1 - Prob. 4TYCh. 2.1 - Prob. 5TYCh. 2.1 - Prob. 6TYCh. 2.1 - Prob. 7TYCh. 2.1 - What are some benefits of representing data sets...Ch. 2.1 - Why should the number of classes in a frequency...Ch. 2.1 - What is the difference between class limits and...
Ch. 2.1 - What is the difference between relative frequency...Ch. 2.1 - After constructing an expanded frequency...Ch. 2.1 - What is the difference between a frequency polygon...Ch. 2.1 - True or False? In Exercises 710, determine whether...Ch. 2.1 - True or False? In Exercises 710, determine whether...Ch. 2.1 - True or False? In Exercises 710, determine whether...Ch. 2.1 - Prob. 10ECh. 2.1 - In Exercises 1114, use the minimum and maximum...Ch. 2.1 - In Exercises 1114, use the minimum and maximum...Ch. 2.1 - In Exercises 1114, use the minimum and maximum...Ch. 2.1 - In Exercises 1114, use the minimum and maximum...Ch. 2.1 - Reading a Frequency Distribution In Exercises 15...Ch. 2.1 - Prob. 15ECh. 2.1 - Prob. 17ECh. 2.1 - Prob. 18ECh. 2.1 - Prob. 19ECh. 2.1 - Prob. 20ECh. 2.1 - Prob. 21ECh. 2.1 - Prob. 22ECh. 2.1 - Prob. 23ECh. 2.1 - Prob. 24ECh. 2.1 - Prob. 25ECh. 2.1 - Prob. 26ECh. 2.1 - Prob. 27ECh. 2.1 - Prob. 28ECh. 2.1 - Prob. 29ECh. 2.1 - Prob. 30ECh. 2.1 - Prob. 31ECh. 2.1 - Constructing a Frequency Distribution and a...Ch. 2.1 - Constructing a Frequency Distribution and a...Ch. 2.1 - Prob. 34ECh. 2.1 - Prob. 35ECh. 2.1 - Prob. 36ECh. 2.1 - Prob. 37ECh. 2.1 - Prob. 38ECh. 2.1 - Prob. 39ECh. 2.1 - Prob. 40ECh. 2.1 - Prob. 41ECh. 2.1 - Prob. 42ECh. 2.1 - In Exercises 43 and 44, use the data set and the...Ch. 2.1 - Prob. 44ECh. 2.1 - What Would You Do? You work at a bank and are...Ch. 2.1 - Prob. 46ECh. 2.1 - Prob. 47ECh. 2.2 - Prob. 1TYCh. 2.2 - Prob. 2TYCh. 2.2 - Prob. 3TYCh. 2.2 - Prob. 4TYCh. 2.2 - Prob. 5TYCh. 2.2 - Prob. 6TYCh. 2.2 - Prob. 7TYCh. 2.2 - Name some ways to display quantitative data...Ch. 2.2 - What is an advantage of using a stem-and-leaf plot...Ch. 2.2 - In terms of displaying data, how is a...Ch. 2.2 - How is a Pareto chart different from a standard...Ch. 2.2 - Putting Graphs in Context In Exercises 58, match...Ch. 2.2 - Putting Graphs in Context In Exercises 58, match...Ch. 2.2 - Putting Graphs in Context In Exercises 58, match...Ch. 2.2 - Putting Graphs in Context In Exercises 58, match...Ch. 2.2 - Graphical Analysis In Exercises 912, use the...Ch. 2.2 - Graphical Analysis In Exercises 912, use the...Ch. 2.2 - Graphical Analysis In Exercises 912, use the...Ch. 2.2 - Prob. 12ECh. 2.2 - Prob. 13ECh. 2.2 - Prob. 14ECh. 2.2 - Prob. 15ECh. 2.2 - Prob. 16ECh. 2.2 - Graphing Data Sets In Exercises 1732, organize the...Ch. 2.2 - Graphing Data Sets In Exercises 1732, organize the...Ch. 2.2 - Prob. 19ECh. 2.2 - Prob. 20ECh. 2.2 - Prob. 21ECh. 2.2 - Prob. 22ECh. 2.2 - Prob. 23ECh. 2.2 - Graphing Data Sets In Exercises 1732, organize the...Ch. 2.2 - Prob. 25ECh. 2.2 - Prob. 26ECh. 2.2 - Prob. 27ECh. 2.2 - Prob. 28ECh. 2.2 - Hourly Wages Use a scatter plot to display the...Ch. 2.2 - Salaries Use a scatter plot to display the data...Ch. 2.2 - Prob. 31ECh. 2.2 - Prob. 32ECh. 2.2 - Prob. 33ECh. 2.2 - Prob. 34ECh. 2.2 - Prob. 35ECh. 2.2 - Favorite Day of the Week Display the data below in...Ch. 2.2 - A Misleading Graph? A misleading graph is not...Ch. 2.2 - Prob. 38ECh. 2.2 - A Misleading Graph? A misleading graph is not...Ch. 2.2 - Prob. 40ECh. 2.2 - Prob. 41ECh. 2.2 - Prob. 42ECh. 2.3 - Find the mean of the points scored by the 51...Ch. 2.3 - Find the median of the points scored by the 51...Ch. 2.3 - The points scored by the winning teams in the...Ch. 2.3 - Find the mode of the points scored by the 51...Ch. 2.3 - In a survey, 1534 adults were asked, How much do...Ch. 2.3 - Remove the data entry 65 from the data set in...Ch. 2.3 - In Example 7, your grade in the two-credit course...Ch. 2.3 - Use a frequency distribution to estimate the mean...Ch. 2.3 - True or False? In Exercises 14, determine whether...Ch. 2.3 - True or False? In Exercises 14, determine whether...Ch. 2.3 - True or False? In Exercises 14, determine whether...Ch. 2.3 - True or False? In Exercises 14, determine whether...Ch. 2.3 - Constructing Data Sets In Exercises 58, construct...Ch. 2.3 - Constructing Data Sets In Exercises 58, construct...Ch. 2.3 - Mean is not representative of a typical number in...Ch. 2.3 - Prob. 8ECh. 2.3 - Graphical Analysis In Exercises 912, determine...Ch. 2.3 - Graphical Analysis In Exercises 912, determine...Ch. 2.3 - Graphical Analysis In Exercises 912, determine...Ch. 2.3 - Graphical Analysis In Exercises 912, determine...Ch. 2.3 - Graphical Analysis In Exercises 912, determine...Ch. 2.3 - Prob. 14ECh. 2.3 - Graphical Analysis In Exercises 912, determine...Ch. 2.3 - Graphical Analysis In Exercises 912, determine...Ch. 2.3 - Prob. 17ECh. 2.3 - Finding and Discussing the Mean, Median, and Mode...Ch. 2.3 - Prob. 19ECh. 2.3 - Prob. 20ECh. 2.3 - Prob. 21ECh. 2.3 - Finding and Discussing the Mean, Median, and Mode...Ch. 2.3 - Prob. 23ECh. 2.3 - Prob. 24ECh. 2.3 - Prob. 25ECh. 2.3 - Finding and Discussing the Mean, Median, and Mode...Ch. 2.3 - Finding and Discussing the Mean, Median, and Mode...Ch. 2.3 - Prob. 28ECh. 2.3 - Prob. 29ECh. 2.3 - Finding and Discussing the Mean, Median, and Mode...Ch. 2.3 - Prob. 31ECh. 2.3 - Finding and Discussing the Mean, Median, and Mode...Ch. 2.3 - Finding and Discussing the Mean, Median, and Mode...Ch. 2.3 - Prob. 34ECh. 2.3 - Prob. 35ECh. 2.3 - Prob. 36ECh. 2.3 - Prob. 37ECh. 2.3 - In Exercises 3740, without performing any...Ch. 2.3 - In Exercises 3740, without performing any...Ch. 2.3 - In Exercises 3740, without performing any...Ch. 2.3 - Prob. 41ECh. 2.3 - Prob. 42ECh. 2.3 - Finding a Weighted Mean In Exercises 4146, find...Ch. 2.3 - Prob. 44ECh. 2.3 - Prob. 45ECh. 2.3 - Prob. 46ECh. 2.3 - Prob. 47ECh. 2.3 - Prob. 48ECh. 2.3 - Prob. 49ECh. 2.3 - Prob. 50ECh. 2.3 - Prob. 51ECh. 2.3 - Prob. 52ECh. 2.3 - Prob. 53ECh. 2.3 - Prob. 54ECh. 2.3 - Identifying the Shape of a Distribution In...Ch. 2.3 - Identifying the Shape of a Distribution In...Ch. 2.3 - Prob. 57ECh. 2.3 - Prob. 58ECh. 2.3 - Prob. 59ECh. 2.3 - Prob. 60ECh. 2.3 - Prob. 61ECh. 2.3 - Prob. 62ECh. 2.3 - Prob. 63ECh. 2.3 - Prob. 64ECh. 2.3 - Data Analysis Students in an experimental...Ch. 2.3 - Trimmed Mean To find the 10% trimmed mean of a...Ch. 2.3 - Specify the lower limit to be 1 and the upper...Ch. 2.3 - Specify the lower limit to be 0 and the upper...Ch. 2.4 - Prob. 1TYCh. 2.4 - Prob. 2TYCh. 2.4 - Prob. 3TYCh. 2.4 - Prob. 4TYCh. 2.4 - Prob. 5TYCh. 2.4 - Prob. 6TYCh. 2.4 - Prob. 7TYCh. 2.4 - Prob. 8TYCh. 2.4 - Prob. 9TYCh. 2.4 - Prob. 10TYCh. 2.4 - Explain how to find the range of a data set. What...Ch. 2.4 - Explain how to find the deviation of an entry in a...Ch. 2.4 - Why is the standard deviation used more frequently...Ch. 2.4 - Explain the relationship between variance and...Ch. 2.4 - Describe the difference between the calculation of...Ch. 2.4 - Given a data set. how do you know whether to...Ch. 2.4 - Discuss the similarities and the differences...Ch. 2.4 - What must you know about a data set before you can...Ch. 2.4 - Prob. 9ECh. 2.4 - Finding the Range of a Data Set In Exercises 9 and...Ch. 2.4 - Archaeology The depths (in inches) at which 10...Ch. 2.4 - In Exercise 11, compare your answer to part (a)...Ch. 2.4 - Prob. 13ECh. 2.4 - Prob. 14ECh. 2.4 - Prob. 15ECh. 2.4 - Prob. 16ECh. 2.4 - Estimating Standard Deviation Both data sets shown...Ch. 2.4 - Estimating Standard Deviation Both data sets shown...Ch. 2.4 - Prob. 19ECh. 2.4 - Prob. 20ECh. 2.4 - Prob. 21ECh. 2.4 - Prob. 22ECh. 2.4 - Prob. 23ECh. 2.4 - Prob. 24ECh. 2.4 - Constructing Data Sets In Exercises 2528,...Ch. 2.4 - Constructing Data Sets In Exercises 2528,...Ch. 2.4 - Constructing Data Sets In Exercises 2528,...Ch. 2.4 - Constructing Data Sets In Exercises 2528,...Ch. 2.4 - Using the Empirical Rule In Exercises 2934, use...Ch. 2.4 - Using the Empirical Rule In Exercises 2934, use...Ch. 2.4 - Using the Empirical Rule In Exercises 2934, use...Ch. 2.4 - Using the Empirical Rule In Exercises 2934, use...Ch. 2.4 - Using the Empirical Rule In Exercises 2934, use...Ch. 2.4 - Using the Empirical Rule In Exercises 2934, use...Ch. 2.4 - Using Chebychevs Theorem You are conducting a...Ch. 2.4 - Prob. 36ECh. 2.4 - Prob. 37ECh. 2.4 - Prob. 38ECh. 2.4 - Prob. 39ECh. 2.4 - Estimating the Sample Mean and Standard Deviation...Ch. 2.4 - Estimating the Sample Mean and Standard Deviation...Ch. 2.4 - Prob. 42ECh. 2.4 - Prob. 43ECh. 2.4 - Prob. 44ECh. 2.4 - Prob. 45ECh. 2.4 - Prob. 46ECh. 2.4 - Prob. 47ECh. 2.4 - Prob. 48ECh. 2.4 - Prob. 49ECh. 2.4 - Prob. 50ECh. 2.4 - Prob. 51ECh. 2.4 - Prob. 52ECh. 2.4 - Prob. 53ECh. 2.4 - Prob. 54ECh. 2.4 - Specify the lower limit to be 10 and the upper...Ch. 2.4 - Specify the lower limit to be 30 and the upper...Ch. 2.4 - Prob. 1CSCh. 2.4 - Prob. 2CSCh. 2.4 - Prob. 3CSCh. 2.4 - Prob. 4CSCh. 2.4 - Prob. 5CSCh. 2.4 - Prob. 6CSCh. 2.5 - Prob. 1TYCh. 2.5 - Prob. 2TYCh. 2.5 - Prob. 3TYCh. 2.5 - Prob. 4TYCh. 2.5 - Prob. 5TYCh. 2.5 - Prob. 6TYCh. 2.5 - Prob. 7TYCh. 2.5 - Prob. 8TYCh. 2.5 - Prob. 1ECh. 2.5 - Prob. 2ECh. 2.5 - Prob. 3ECh. 2.5 - Prob. 4ECh. 2.5 - Explain how to identify outliers using the...Ch. 2.5 - Describe the relationship between quartiles and...Ch. 2.5 - True or False? In Exercises 710, determine whether...Ch. 2.5 - True or False? In Exercises 710, determine whether...Ch. 2.5 - True or False? In Exercises 710, determine whether...Ch. 2.5 - True or False? In Exercises 710, determine whether...Ch. 2.5 - Finding Quartiles, Interquartile Range, and...Ch. 2.5 - Prob. 12ECh. 2.5 - Prob. 13ECh. 2.5 - Prob. 14ECh. 2.5 - Prob. 15ECh. 2.5 - Prob. 16ECh. 2.5 - Drawing a Box-and-Whisker Plot In Exercises 1518,...Ch. 2.5 - Drawing a Box-and-Whisker Plot In Exercises 1518,...Ch. 2.5 - Drawing a Box-and-Whisker Plot In Exercises 1518,...Ch. 2.5 - Prob. 20ECh. 2.5 - Graphical Analysis In Exercises 1922, use the...Ch. 2.5 - Graphical Analysis In Exercises 1922, use the...Ch. 2.5 - Graphical Analysis In Exercises 1922, use the...Ch. 2.5 - Graphical Analysis In Exercises 1922, use the...Ch. 2.5 - Prob. 25ECh. 2.5 - Using Technology to Find Quartiles and Draw Graphs...Ch. 2.5 - Prob. 27ECh. 2.5 - Prob. 28ECh. 2.5 - Prob. 29ECh. 2.5 - Prob. 30ECh. 2.5 - Prob. 31ECh. 2.5 - Prob. 32ECh. 2.5 - Prob. 33ECh. 2.5 - Prob. 34ECh. 2.5 - Finding a Percentile In Exercises 3336, use the...Ch. 2.5 - Finding a Percentile In Exercises 3336, use the...Ch. 2.5 - Finding a Percentile In Exercises 3336, use the...Ch. 2.5 - Finding a Percentile In Exercises 3336, use the...Ch. 2.5 - Prob. 39ECh. 2.5 - Prob. 40ECh. 2.5 - Prob. 41ECh. 2.5 - Prob. 42ECh. 2.5 - Prob. 43ECh. 2.5 - Prob. 44ECh. 2.5 - Prob. 45ECh. 2.5 - Prob. 46ECh. 2.5 - Life Spans of Tires A brand of automobile tire has...Ch. 2.5 - Life Spans of Fruit Flies The life spans of a...Ch. 2.5 - Prob. 49ECh. 2.5 - Prob. 50ECh. 2.5 - Prob. 51ECh. 2.5 - Prob. 52ECh. 2.5 - Prob. 53ECh. 2.5 - Prob. 54ECh. 2.5 - Song Lengths Side-by-side box-and-whisker plots...Ch. 2.5 - Credit Card Purchases The credit card purchases...Ch. 2.5 - Modified Box-and-Whisker Plot In Exercises 5962,...Ch. 2.5 - Modified Box-and-Whisker Plot In Exercises 5962,...Ch. 2 - Prob. 2.1.1RECh. 2 - Prob. 2.1.2RECh. 2 - Prob. 2.1.3RECh. 2 - Prob. 2.1.4RECh. 2 - Prob. 2.1.5RECh. 2 - Prob. 2.1.6RECh. 2 - Prob. 2.2.7RECh. 2 - Prob. 2.2.8RECh. 2 - Prob. 2.2.9RECh. 2 - Prob. 2.2.10RECh. 2 - Prob. 2.2.11RECh. 2 - Prob. 2.2.12RECh. 2 - Prob. 2.3.13RECh. 2 - Prob. 2.3.14RECh. 2 - For the six test scores 78, 72, 86, 91, 87, and...Ch. 2 - For the four test scores 96, 85, 91, and 86, the...Ch. 2 - Estimate the mean of the frequency distribution...Ch. 2 - The frequency distribution shows the numbers of...Ch. 2 - Prob. 2.3.19RECh. 2 - Prob. 2.3.20RECh. 2 - In Exercises 21 and 22, determine whether the...Ch. 2 - In Exercises 21 and 22, determine whether the...Ch. 2 - Prob. 2.3.23RECh. 2 - For the histogram in Exercise 21, which is...Ch. 2 - In Exercises 25 and 26, find the range, mean,...Ch. 2 - Prob. 2.4.26RECh. 2 - Prob. 2.4.27RECh. 2 - Prob. 2.4.28RECh. 2 - Prob. 2.4.29RECh. 2 - Prob. 2.4.30RECh. 2 - Prob. 2.4.31RECh. 2 - Prob. 2.4.32RECh. 2 - From a random sample of households, the numbers of...Ch. 2 - From a random sample of airplanes, the numbers of...Ch. 2 - In Exercises 35 and 36, find the coefficient of...Ch. 2 - Prob. 2.4.36RECh. 2 - Prob. 2.5.37RECh. 2 - Prob. 2.5.38RECh. 2 - Prob. 2.5.39RECh. 2 - Prob. 2.5.40RECh. 2 - Prob. 2.5.41RECh. 2 - Prob. 2.5.42RECh. 2 - A students test grade of 75 represents the 65th...Ch. 2 - Prob. 2.5.44RECh. 2 - Prob. 2.5.45RECh. 2 - Prob. 2.5.46RECh. 2 - Prob. 2.5.47RECh. 2 - Prob. 2.5.48RECh. 2 - Prob. 1CQCh. 2 - Prob. 2CQCh. 2 - Prob. 3CQCh. 2 - Prob. 4CQCh. 2 - Prob. 5CQCh. 2 - Prob. 6CQCh. 2 - Prob. 7CQCh. 2 - Prob. 1CTCh. 2 - Prob. 2CTCh. 2 - Prob. 3CTCh. 2 - Prob. 4CTCh. 2 - Prob. 5CTCh. 2 - Prob. 6CTCh. 2 - Prob. 7CTCh. 2 - Prob. 8CTCh. 2 - Prob. 1RSRDCh. 2 - Prob. 2RSRDCh. 2 - Prob. 3RSRDCh. 2 - Prob. 1TCh. 2 - Prob. 2TCh. 2 - Prob. 3TCh. 2 - Prob. 4TCh. 2 - Prob. 5TCh. 2 - Prob. 6TCh. 2 - Prob. 7TCh. 2 - Prob. 8TCh. 2 - Prob. 9TCh. 2 - Prob. 10TCh. 2 - In Exercices 1 and 2, identify the sampling...Ch. 2 - Prob. 2CRCh. 2 - Prob. 3CRCh. 2 - Prob. 4CRCh. 2 - Prob. 5CRCh. 2 - Prob. 6CRCh. 2 - Prob. 7CRCh. 2 - Prob. 8CRCh. 2 - Prob. 9CRCh. 2 - Prob. 10CRCh. 2 - Prob. 11CRCh. 2 - Prob. 12CRCh. 2 - Prob. 13CRCh. 2 - Prob. 14CRCh. 2 - Tail lengths (in feet) for a sample of American...Ch. 2 - Prob. 16CRCh. 2 - Prob. 17CRCh. 2 - Prob. 18CRCh. 2 - Prob. 19CR
Knowledge Booster


Learn more about
Need a deep-dive on the concept behind this application? Look no further. Learn more about this topic, statistics and related others by exploring similar questions and additional content below.Similar questions
- Name Harvard University California Institute of Technology Massachusetts Institute of Technology Stanford University Princeton University University of Cambridge University of Oxford University of California, Berkeley Imperial College London Yale University University of California, Los Angeles University of Chicago Johns Hopkins University Cornell University ETH Zurich University of Michigan University of Toronto Columbia University University of Pennsylvania Carnegie Mellon University University of Hong Kong University College London University of Washington Duke University Northwestern University University of Tokyo Georgia Institute of Technology Pohang University of Science and Technology University of California, Santa Barbara University of British Columbia University of North Carolina at Chapel Hill University of California, San Diego University of Illinois at Urbana-Champaign National University of Singapore…arrow_forwardA company found that the daily sales revenue of its flagship product follows a normal distribution with a mean of $4500 and a standard deviation of $450. The company defines a "high-sales day" that is, any day with sales exceeding $4800. please provide a step by step on how to get the answers in excel Q: What percentage of days can the company expect to have "high-sales days" or sales greater than $4800? Q: What is the sales revenue threshold for the bottom 10% of days? (please note that 10% refers to the probability/area under bell curve towards the lower tail of bell curve) Provide answers in the yellow cellsarrow_forwardFind the critical value for a left-tailed test using the F distribution with a 0.025, degrees of freedom in the numerator=12, and degrees of freedom in the denominator = 50. A portion of the table of critical values of the F-distribution is provided. Click the icon to view the partial table of critical values of the F-distribution. What is the critical value? (Round to two decimal places as needed.)arrow_forward
- A retail store manager claims that the average daily sales of the store are $1,500. You aim to test whether the actual average daily sales differ significantly from this claimed value. You can provide your answer by inserting a text box and the answer must include: Null hypothesis, Alternative hypothesis, Show answer (output table/summary table), and Conclusion based on the P value. Showing the calculation is a must. If calculation is missing,so please provide a step by step on the answers Numerical answers in the yellow cellsarrow_forwardShow all workarrow_forwardShow all workarrow_forward
arrow_back_ios
SEE MORE QUESTIONS
arrow_forward_ios
Recommended textbooks for you
 Glencoe Algebra 1, Student Edition, 9780079039897...AlgebraISBN:9780079039897Author:CarterPublisher:McGraw Hill
 Holt Mcdougal Larson Pre-algebra: Student Edition...AlgebraISBN:9780547587776Author:HOLT MCDOUGALPublisher:HOLT MCDOUGAL
 Big Ideas Math A Bridge To Success Algebra 1: Stu...AlgebraISBN:9781680331141Author:HOUGHTON MIFFLIN HARCOURTPublisher:Houghton Mifflin Harcourt
Glencoe Algebra 1, Student Edition, 9780079039897...
Algebra
ISBN:9780079039897
Author:Carter
Publisher:McGraw Hill
Holt Mcdougal Larson Pre-algebra: Student Edition...
Algebra
ISBN:9780547587776
Author:HOLT MCDOUGAL
Publisher:HOLT MCDOUGAL
Big Ideas Math A Bridge To Success Algebra 1: Stu...
Algebra
ISBN:9781680331141
Author:HOUGHTON MIFFLIN HARCOURT
Publisher:Houghton Mifflin Harcourt
How to make Frequency Distribution Table / Tally Marks and Frequency Distribution Table; Author: Reenu Math;https://www.youtube.com/watch?v=i_A6RiE8tLE;License: Standard YouTube License, CC-BY
Frequency distribution table in statistics; Author: Math and Science;https://www.youtube.com/watch?v=T7KYO76DoOE;License: Standard YouTube License, CC-BY
Frequency Distribution Table for Grouped/Continuous data | Math Dot Com; Author: Maths dotcom;https://www.youtube.com/watch?v=ErnccbXQOPY;License: Standard Youtube License