
Connect Hosted by ALEKS Access Card or Elementary Statistics
3rd Edition
ISBN: 9781260373752
Author: William Navidi Prof., Barry Monk Professor
Publisher: McGraw-Hill Education
expand_more
expand_more
format_list_bulleted
Concept explainers
Videos
Textbook Question
Chapter 2.3, Problem 36E
Arctic ice sheet: The following table presents the extent of ice coverage (in millions of square kilometers) in the Arctic region in September of each year from 2002 through 2015.
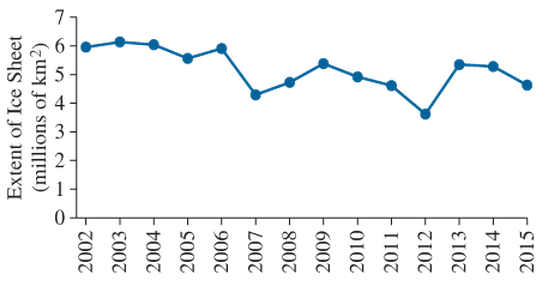
- What was the first year that the coverage dropped below 5 million square kilometers?
- What was the first year that the coverage dropped below 4 million square kilometers?
- True or false: The coverage has been less than 5 million square kilometers in every year since 2011.
- True or false: The coverage has decreased in every year since 2011.
Expert Solution & Answer
Want to see the full answer?
Check out a sample textbook solution
Students have asked these similar questions
y of 45 home-
televisions
u find that
010020
le own one,
ee, and 1 owns
y histogram of
4
Suppose that you have a loaded die. You roll
it several times and record the outcomes,
which are shown in the following figure.
Histogram for Loaded Die
444%
34.00
48%
6%
2%
Frequency
20
20
15
155
10
5-
ம
0
1
2
3
4
Outcome
5
6
a. Make a relative frequency histogram of
these results.
b. You can make a relative frequency histo-
gram from a frequency histogram; can
you go the other direction?
Calculate the mean for Study Hours and Test Scores.
Compute the covariance between the two variables using the formula:
Calculate the standard deviation for Study Hours (X) and Test Scores (Y).
Determine the correlation coefficient
Interpret the results: What does the calculated r-value indicate about the relationship between study hours and test scores?
For unemployed persons in the United States, the average number of months of unemployment at the end of December 2009 was approximately seven months (Bureau of Labor Statistics, January 2010). Suppose the following data are for a particular region in upstate New York. The values in the first column show the number of
months unemployed and the values in the second column show the corresponding number of unemployed persons.
Months
Unemployed
Number
Unemployed
1
1029
2
1686
3
2269
4
2675
5
3487
6
4652
7
4145
8
3587
9
2325
10
1120
Let x be a random variable indicating the number of months a person is unemployed.
a. Use the data to develop an empirical discrete probability distribution for x (to 4 decimals).
(x)
f(x)
1
2
3
4
5
6
7
8
9
10
b. Show that your probability distribution satisfies the conditions for a valid discrete probability distribution.
The input in the box below will not be graded, but may be reviewed and considered by your instructor.
blank
c. What is the probability that a…
Chapter 2 Solutions
Connect Hosted by ALEKS Access Card or Elementary Statistics
Ch. 2.1 - In Exercises 5-8, fill in each blank with the...Ch. 2.1 - In Exercises 5-8, fill in each blank with the...Ch. 2.1 - In Exercises 5-8, fill in each blank with the...Ch. 2.1 - In Exercises 5-8, fill in each blank with the...Ch. 2.1 - In Exercises 9—12, determine whether the...Ch. 2.1 - In Exercises 9—12, determine whether the...Ch. 2.1 - In Exercises 9—12, determine whether the...Ch. 2.1 - In Exercises 9—12, determine whether the...Ch. 2.1 - The following bar graph presents the average...Ch. 2.1 - The most common blood typing system divides human...
Ch. 2.1 - Following is a pie chart that presents the...Ch. 2.1 - Government spending: The following pie chart...Ch. 2.1 - U.S. population: The following side-by-side bar...Ch. 2.1 - Super Bowl: The following side-by-side bar graph...Ch. 2.1 - Smartphone sales: The following frequency...Ch. 2.1 - Popular video games: The following frequency...Ch. 2.1 - More smartphones: Using the data in Exercise 19:...Ch. 2.1 - More video games: Using the data in Exercise 20:...Ch. 2.1 - Hospital admissions: The following frequency...Ch. 2.1 - World population: Following are the populations of...Ch. 2.1 - Ages of video garners: The Nielsen Company...Ch. 2.1 - How secure is your job? In a survey, employed...Ch. 2.1 - Back up your data: In a survey commissioned by the...Ch. 2.1 - Education levels: The following frequency...Ch. 2.1 - Twitter followers: The following frequency...Ch. 2.1 - Music sales: The following frequency distribution...Ch. 2.1 - Keeping up with the Kardashians: The following...Ch. 2.1 - Bought a new car lately? The following table...Ch. 2.1 - Bought a new- truck lately? The following table...Ch. 2.1 - Happy Halloween: The following table presents...Ch. 2.1 - Native languages: The following frequency...Ch. 2.1 - Proportion of females: Following are the...Ch. 2.2 - Prob. 5ECh. 2.2 - In Exercises 5—8, fill in each blank with the...Ch. 2.2 - In Exercises 5—8, fill in each blank with the...Ch. 2.2 - In Exercises 5—8, fill in each blank with the...Ch. 2.2 - In Exercises 9—12, determine whether the...Ch. 2.2 - In Exercises 9—12, determine whether the...Ch. 2.2 - In Exercises 9—12, determine whether the...Ch. 2.2 - In Exercises 9—12, determine whether the...Ch. 2.2 - In Exercises 13—16, classify the histogram as...Ch. 2.2 - In Exercises 13—16, classify the histogram as...Ch. 2.2 - In Exercises 13—16, classify the histogram as...Ch. 2.2 - In Exercises 13—16, classify the histogram as...Ch. 2.2 - In Exercises 17 and 18, classify the histogram as...Ch. 2.2 - In Exercises 17 and 18, classify the histogram as...Ch. 2.2 - Student heights: The following frequency histogram...Ch. 2.2 - Trained rats: Forty rats were trained to run a...Ch. 2.2 - Cholesterol: The following histogram shows the...Ch. 2.2 - Blood pressure: The following histogram shows the...Ch. 2.2 - Olympic athletes: The following frequency...Ch. 2.2 - Hows the weather? The following relative frequency...Ch. 2.2 - Skewed which way? For which of the following data...Ch. 2.2 - Skewed which way? For which of the following data...Ch. 2.2 - Batting average: The following frequency...Ch. 2.2 - Batting average: The following frequency...Ch. 2.2 - Time spent playing video games: A sample of 200...Ch. 2.2 - Murder, she wrote: The following frequency...Ch. 2.2 - BMW prices: The following table presents the...Ch. 2.2 - Geysers: The geyser Old Faithful in Yellowstone...Ch. 2.2 - Hail to the chief: There have been 58 presidential...Ch. 2.2 - Internet radio: The following table presents the...Ch. 2.2 - Brothers and sisters: Thirty students in a...Ch. 2.2 - Cough, cough: The following table presents the...Ch. 2.2 - Prob. 37ECh. 2.2 - Prob. 38ECh. 2.2 - Prob. 39ECh. 2.2 - Prob. 40ECh. 2.2 - Frequency polygon: Using the data in Exercise 29:...Ch. 2.2 - Prob. 42ECh. 2.2 - Ogive: Using the data in Exercise 27: Compute the...Ch. 2.2 - Ogive: Using the data in Exercise 28: Compute the...Ch. 2.2 - Ogive: Using the data in Exercise 29: Compute the...Ch. 2.2 - Prob. 46ECh. 2.2 - Prob. 47ECh. 2.2 - Prob. 48ECh. 2.2 - Prob. 49ECh. 2.2 - Prob. 50ECh. 2.2 - Prob. 51ECh. 2.2 - Prob. 52ECh. 2.2 - Frequencies and relative frequencies: The...Ch. 2.3 - In Exercises 3—6, fill in each blank with the...Ch. 2.3 - In Exercises 3—6, fill in each blank with the...Ch. 2.3 - In Exercises 3—6, fill in each blank with the...Ch. 2.3 - In Exercises 3—6, fill in each blank with the...Ch. 2.3 - Prob. 7ECh. 2.3 - In Exercises 7—10, determine whether the...Ch. 2.3 - In Exercises 7—10, determine whether the...Ch. 2.3 - In Exercises 7—10, determine whether the...Ch. 2.3 - Construct a stem-and-leaf plot for the following...Ch. 2.3 - Construct a stem-and-leaf plot for the following...Ch. 2.3 - List the data in the following stem-and-leaf plot....Ch. 2.3 - List the data in the following stein-and-leaf...Ch. 2.3 - Construct a dotplot for the data in Exercise 11.Ch. 2.3 - Prob. 16ECh. 2.3 - BMW prices: The following table presents the...Ch. 2.3 - Hows the weather? The following table presents the...Ch. 2.3 - Air pollution: The following table presents...Ch. 2.3 - Technology salaries: The following table presents...Ch. 2.3 - Tennis and golf: Following are the ages of the...Ch. 2.3 - Pass the popcorn: Following are the running times...Ch. 2.3 - More weather: Construct a dotplot for the data in...Ch. 2.3 - Prob. 24ECh. 2.3 - Looking for a job: The following table presents...Ch. 2.3 - Prob. 26ECh. 2.3 - Military spending: The following table presents...Ch. 2.3 - Prob. 28ECh. 2.3 - Dining out: The following time-series plot...Ch. 2.3 - Prob. 30ECh. 2.3 - Prob. 31ECh. 2.3 - More gold: The following time series plot presents...Ch. 2.3 - Prob. 33ECh. 2.3 - Prob. 34ECh. 2.3 - Vote: The following time-series plot presents the...Ch. 2.3 - Arctic ice sheet: The following table presents the...Ch. 2.3 - Prob. 37ECh. 2.4 - In Exercises 3 and 4, fill in each blank with the...Ch. 2.4 - In Exercises 3 and 4, fill in each blank with the...Ch. 2.4 - CD sales decline: Sales of CDs have been declining...Ch. 2.4 - Music sales: The following time-series plot and...Ch. 2.4 - Stock market prices: The Dow Jones Industrial...Ch. 2.4 - Save your money: In 2007, U.S. residents saved...Ch. 2.4 - Ill take mine with mustard: The following bar...Ch. 2.4 - Stream or download? The following bar graph...Ch. 2.4 - Female senators: Of the 100 members of the United...Ch. 2.4 - Age at marriage: Data compiled by the U.S. Census...Ch. 2.4 - College degrees: Both of the following time-series...Ch. 2.4 - Food expenditures: Both of the following...Ch. 2.4 - Prob. 15ECh. 2 - Following is the list of letter grades for...Ch. 2 - Prob. 2CQCh. 2 - Construct a frequency bar graph for the data in...Ch. 2 - Prob. 4CQCh. 2 - Prob. 5CQCh. 2 - Prob. 6CQCh. 2 - Prob. 7CQCh. 2 - Prob. 8CQCh. 2 - Prob. 9CQCh. 2 - Prob. 10CQCh. 2 - Following are the prices (in dollars) for a sample...Ch. 2 - Prob. 12CQCh. 2 - Prob. 13CQCh. 2 - Prob. 14CQCh. 2 - Prob. 15CQCh. 2 - Trust your doctor: The General Social Survey...Ch. 2 - Internet browsers: The following relative...Ch. 2 - Prob. 3RECh. 2 - Prob. 4RECh. 2 - Prob. 5RECh. 2 - House freshmen: Newly elected members of the U.S....Ch. 2 - More freshmen: For the data in Exercise 6:...Ch. 2 - Royalty: Following are the ages at death for all...Ch. 2 - Prob. 9RECh. 2 - Prob. 10RECh. 2 - Prob. 11RECh. 2 - Prob. 12RECh. 2 - Prob. 13RECh. 2 - Prob. 14RECh. 2 - Prob. 15RECh. 2 - Explain why the frequency bar graph and the...Ch. 2 - Prob. 2WAICh. 2 - Prob. 3WAICh. 2 - Prob. 4WAICh. 2 - Prob. 5WAICh. 2 - In the chapter introduction, we presented gas...Ch. 2 - In the chapter introduction, we presented gas...Ch. 2 - In the chapter introduction, we presented gas...Ch. 2 - Prob. 4CSCh. 2 - In the chapter introduction, we presented gas...Ch. 2 - Prob. 6CSCh. 2 - In the chapter introduction, we presented gas...Ch. 2 - Prob. 8CSCh. 2 - In the chapter introduction, we presented gas...
Knowledge Booster


Learn more about
Need a deep-dive on the concept behind this application? Look no further. Learn more about this topic, statistics and related others by exploring similar questions and additional content below.Similar questions
- West Virginia has one of the highest divorce rates in the nation, with an annual rate of approximately 5 divorces per 1000 people (Centers for Disease Control and Prevention website, January 12, 2012). The Marital Counseling Center, Inc. (MCC) thinks that the high divorce rate in the state may require them to hire additional staff. Working with a consultant, the management of MCC has developed the following probability distribution for x = the number of new clients for marriage counseling for the next year. Excel File: data05-19.xls x 10 f(x) .05 20 30 .10 .10 40 .20 50 60 .35 .20 a. Is this probability distribution valid? - Select your answer- Explain. f(x) Σf(x) Select your answer Select your answer b. What is the probability MCC will obtain more than 30 new clients (to 2 decimals)? c. What is the probability MCC will obtain fewer than 20 new clients (to 2 decimals)? d. Compute the expected value and variance of x. Expected value Variance clients per year squared clients per yeararrow_forwardFor unemployed persons in the United States, the average number of months of unemployment at the end of December 2009 was approximately seven months (Bureau of Labor Statistics, January 2010). Suppose the following data are for a particular region in upstate New York. The values in the first column show the number of months unemployed and the values in the second column show the corresponding number of unemployed persons. Months Unemployed Number Unemployed 1 1029 2 1686 3 2269 4 2675 5 3487 6 4652 7 4145 8 3587 9 2325 10 1120 Let x be a random variable indicating the number of months a person is unemployed. a. Use the data to develop an empirical discrete probability distribution for x (to 4 decimals). (x) f(x) 1 2 3 4 5 6 7 8 9 10 b. Show that your probability distribution satisfies the conditions for a valid discrete probability distribution. The input in the box below will not be graded, but may be reviewed and considered by your instructor. c. What is the probability that a person…arrow_forwardIn Gallup's Annual Consumption Habits Poll, telephone interviews were conducted for a random sample of 1014 adults aged 18 and over. One of the questions was "How many cups of coffee, if any, do you drink on an average day?" The following table shows the results obtained (Gallup website, August 6, 2012). Excel File: data05-23.xls Number of Cups per Day Number of Responses 0 365 264 193 3 4 or more 91 101 Define a random variable x = number of cups of coffee consumed on an average day. Let x = 4 represent four or more cups. Round your answers to four decimal places. a. Develop a probability distribution for x. x 0 1 2 3 4 f(x) b. Compute the expected value of x. cups of coffee c. Compute the variance of x. cups of coffee squared d. Suppose we are only interested in adults that drink at least one cup of coffee on an average day. For this group, let y = the number of cups of coffee consumed on an average day. Compute the expected value of y. Compare it to the expected value of x. The…arrow_forward
- In Gallup's Annual Consumption Habits Poll, telephone interviews were conducted for a random sample of 1014 adults aged 18 and over. One of the questions was "How many cups of coffee, if any, do you drink on an average day?" The following table shows the results obtained (Gallup website, August 6, 2012). Excel File: data05-23.xls Number of Cups per Day Number of Responses 0 365 264 193 2 3 4 or more 91 101 Define a random variable x = number of cups of coffee consumed on an average day. Let x = 4 represent four or more cups. Round your answers to four decimal places. a. Develop a probability distribution for x. x 0 1 2 3 f(x) b. Compute the expected value of x. cups of coffee c. Compute the variance of x. cups of coffee squared d. Suppose we are only interested in adults that drink at least one cup of coffee on an average day. For this group, let y = the number of cups of coffee consumed on an average day. Compute the expected value of y. Compare it to the expected value of x. The…arrow_forwardA technician services mailing machines at companies in the Phoenix area. Depending on the type of malfunction, the service call can take 1, 2, 3, or 4 hours. The different types of malfunctions occur at about the same frequency. Develop a probability distribution for the duration of a service call. Duration of Call x f(x) 1 2 3 4 Which of the following probability distribution graphs accurately represents the data set? Consider the required conditions for a discrete probability function, shown below.Does this probability distribution satisfy equation (5.1)?Does this probability distribution satisfy equation (5.2)? What is the probability a service call will take three hours? A service call has just come in, but the type of malfunction is unknown. It is 3:00 P.M. and service technicians usually get off at 5:00 P.M. What is the probability the service technician will have to work overtime to fix the machine today?arrow_forwardA psychologist determined that the number of sessions required to obtain the trust of a new patient is either 1, 2, or 3. Let x be a random variable indicating the number of sessions required to gain the patient's trust. The following probability function has been proposed. x f(x) for x = 1, 2, or 3 a. Consider the required conditions for a discrete probability function, shown below. f(x) ≥0 Σf(x) = 1 (5.1) (5.2) Does this probability distribution satisfy equation (5.1)? Select Does this probability distribution satisfy equation (5.2)? Select b. What is the probability that it takes exactly 2 sessions to gain the patient's trust (to 3 decimals)? c. What is the probability that it takes at least 2 sessions to gain the patient's trust (to 3 decimals)?arrow_forward
- A technician services mailing machines at companies in the Phoenix area. Depending on the type of malfunction, the service call can take 1, 2, 3, or 4 hours. The different types of malfunctions occur at about the same frequency. Develop a probability distribution for the duration of a service call. Which of the following probability distribution graphs accurately represents the data set? Consider the required conditions for a discrete probability function, shown below.Does this probability distribution satisfy equation (5.1)?Does this probability distribution satisfy equation (5.2)? What is the probability a service call will take three hours? A service call has just come in, but the type of malfunction is unknown. It is 3:00 P.M. and service technicians usually get off at 5:00 P.M. What is the probability the service technician will have to work overtime to fix the machine today?arrow_forwardWest Virginia has one of the highest divorce rates in the nation, with an annual rate of approximately 5 divorces per 1000 people (Centers for Disease Control and Prevention website, January 12, 2012). The Marital Counseling Center, Inc. (MCC) thinks that the high divorce rate in the state may require them to hire additional staff. Working with a consultant, the management of MCC has developed the following probability distribution for x = the number of new clients for marriage counseling for the next year. Excel File: data05-19.xls 10 20 f(x) .05 .10 11 30 40 50 60 .10 .20 .35 .20 a. Is this probability distribution valid? Yes Explain. greater than or equal to 0 f(x) Σf(x) equal to 1 b. What is the probability MCC will obtain more than 30 new clients (to 2 decimals)? c. What is the probability MCC will obtain fewer than 20 new clients (to 2 decimals)? d. Compute the expected value and variance of x. Expected value Variance clients per year squared clients per yeararrow_forwardReconsider the patient satisfaction data in Table 1. Fit a multiple regression model using both patient age and severity as the regressors. (a) Test for significance of regression. (b) Test for the individual contribution of the two regressors. Are both regressor variables needed in the model? (c) Has adding severity to the model improved the quality of the model fit? Explain your answer.arrow_forward
- The output voltage of a power supply is assumed to be normally distributed. Sixteen observations taken at random on voltage are as follows: 10.35, 9.30, 10.00, 9.96, 11.65, 12.00, 11.25, 9.58, 11.54, 9.95, 10.28, 8.37, 10.44, 9.25, 9.38, and 10.85. (a) Test the hypothesis that the mean voltage equals 12 V against a two-sided alternative using a = 0.05. (b) Construct a 95% two-sided confidence interval on μ. (c) Test the hypothesis that σ² = 11 using α = 0.05. (d) Construct a 95% two-sided confidence interval on σ. (e) Construct a 95% upper confidence interval on σ. (f) Does the assumption of normality seem reasonable for the output voltage?arrow_forwardAnalyze the residuals from the regression model on the patient satisfaction data from Exercise 3. Comment on the adequacy of the regression model.arrow_forwardConsider the hypotheses: Hop=po H₁ppo where 2 is known. Derive a general expression for determining the sample size for detecting a true mean of 1μo with probability 1-ẞ if the type I error is a.arrow_forward
arrow_back_ios
SEE MORE QUESTIONS
arrow_forward_ios
Recommended textbooks for you
 College Algebra (MindTap Course List)AlgebraISBN:9781305652231Author:R. David Gustafson, Jeff HughesPublisher:Cengage Learning
 Algebra: Structure And Method, Book 1AlgebraISBN:9780395977224Author:Richard G. Brown, Mary P. Dolciani, Robert H. Sorgenfrey, William L. ColePublisher:McDougal Littell
 Intermediate AlgebraAlgebraISBN:9781285195728Author:Jerome E. Kaufmann, Karen L. SchwittersPublisher:Cengage Learning
 Elementary AlgebraAlgebraISBN:9780998625713Author:Lynn Marecek, MaryAnne Anthony-SmithPublisher:OpenStax - Rice University
 Glencoe Algebra 1, Student Edition, 9780079039897...AlgebraISBN:9780079039897Author:CarterPublisher:McGraw Hill
College Algebra (MindTap Course List)
Algebra
ISBN:9781305652231
Author:R. David Gustafson, Jeff Hughes
Publisher:Cengage Learning
Algebra: Structure And Method, Book 1
Algebra
ISBN:9780395977224
Author:Richard G. Brown, Mary P. Dolciani, Robert H. Sorgenfrey, William L. Cole
Publisher:McDougal Littell
Intermediate Algebra
Algebra
ISBN:9781285195728
Author:Jerome E. Kaufmann, Karen L. Schwitters
Publisher:Cengage Learning
Elementary Algebra
Algebra
ISBN:9780998625713
Author:Lynn Marecek, MaryAnne Anthony-Smith
Publisher:OpenStax - Rice University
Glencoe Algebra 1, Student Edition, 9780079039897...
Algebra
ISBN:9780079039897
Author:Carter
Publisher:McGraw Hill
Mod-01 Lec-01 Discrete probability distributions (Part 1); Author: nptelhrd;https://www.youtube.com/watch?v=6x1pL9Yov1k;License: Standard YouTube License, CC-BY
Discrete Probability Distributions; Author: Learn Something;https://www.youtube.com/watch?v=m9U4UelWLFs;License: Standard YouTube License, CC-BY
Probability Distribution Functions (PMF, PDF, CDF); Author: zedstatistics;https://www.youtube.com/watch?v=YXLVjCKVP7U;License: Standard YouTube License, CC-BY
Discrete Distributions: Binomial, Poisson and Hypergeometric | Statistics for Data Science; Author: Dr. Bharatendra Rai;https://www.youtube.com/watch?v=lHhyy4JMigg;License: Standard Youtube License