
Statistics for Business & Economics
16th Edition
ISBN: 9781337325448
Author: Anderson
Publisher: CENGAGE C
expand_more
expand_more
format_list_bulleted
Concept explainers
Videos
Textbook Question
thumb_up100%
Chapter 2.3, Problem 28E
The following observations are for two quantitative variables, x and y.
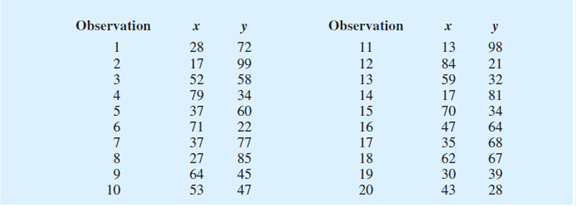
- a. develop a crosstabulation for the data, with x as the row variable and y as the column variable. For x use classes of 10–29, 30–49, and so on; for y use classes of 40–59, 60–79, and so on.
- b. Compute the row percentages.
- c. Compute the column percentages.
- d. What is the relationship, if any, between x and y?
Expert Solution & Answer

Trending nowThis is a popular solution!

Students have asked these similar questions
Please provide the solution for the attached image in detailed.
20 km, because
GISS
Worksheet 10
Jesse runs a small business selling and delivering mealie meal to the spaza shops.
He charges a fixed rate of R80, 00 for delivery and then R15, 50 for each packet of
mealle meal he delivers. The table below helps him to calculate what to charge
his customers.
10
20
30
40
50
Packets of mealie
meal (m)
Total costs in Rands
80
235
390
545
700
855
(c)
10.1.
Define the following terms:
10.1.1. Independent Variables
10.1.2. Dependent Variables
10.2.
10.3.
10.4.
10.5.
Determine the independent and dependent variables.
Are the variables in this scenario discrete or continuous values? Explain
What shape do you expect the graph to be? Why?
Draw a graph on the graph provided to represent the information in the
table above.
TOTAL COST OF PACKETS OF MEALIE MEAL
900
800
700
600
COST (R)
500
400
300
200
100
0
10
20
30
40
60
NUMBER OF PACKETS OF MEALIE MEAL
Let X be a random variable with support SX = {−3, 0.5, 3, −2.5, 3.5}. Part ofits probability mass function (PMF) is given bypX(−3) = 0.15, pX(−2.5) = 0.3, pX(3) = 0.2, pX(3.5) = 0.15.(a) Find pX(0.5).(b) Find the cumulative distribution function (CDF), FX(x), of X.1(c) Sketch the graph of FX(x).
Chapter 2 Solutions
Statistics for Business & Economics
Ch. 2.1 - Methods 1. The response to a question has three...Ch. 2.1 - A partial relative frequency distribution is...Ch. 2.1 - A questionnaire provides 58 Yes, 42 No, and 20...Ch. 2.1 - for the 20102011 viewing season, the top five...Ch. 2.1 - In alphabetical order, the six most common last...Ch. 2.1 - Nielsen Media Research provided the list of the 25...Ch. 2.1 - The Canmark Research Center Airport Customer...Ch. 2.1 - Data for a sample of 55 members of the Baseball...Ch. 2.1 - Nearly 1.8 million bachelors degrees and over...Ch. 2.1 - VirtualTourist provides ratings for hotels...
Ch. 2.2 - Consider the following data. a. Develop a...Ch. 2.2 - Consider the following frequency distribution....Ch. 2.2 - Construct a histogram for the data in exercise 12.Ch. 2.2 - Consider the following data. a. Construct a dot...Ch. 2.2 - Construct a stem-and-leaf display for the...Ch. 2.2 - Construct a stem-and-leaf display for the...Ch. 2.2 - Applications A doctors office staff studied the...Ch. 2.2 - CBSSports.com developed the Total Player Ratings...Ch. 2.2 - Based on the tons handled in a year, the ports...Ch. 2.2 - The London School of Economics and the Harvard...Ch. 2.2 - Fortune provides a list of Americas largest...Ch. 2.2 - entrepreneur magazine ranks franchises using...Ch. 2.2 - The DATAfile EngineeringSalary contains the median...Ch. 2.2 - Each year America.EDU ranks the best paying...Ch. 2.2 - The 2011 Cincinnati Flying Pig Half-Marathon (13.1...Ch. 2.3 - The following data are for 30 observations...Ch. 2.3 - The following observations are for two...Ch. 2.3 - The Daytona 500 is a 500-mile automobile race held...Ch. 2.3 - The following crosstabulation shows the average...Ch. 2.3 - Recently, management at Oak Tree Golf Course...Ch. 2.3 - The following crosstabulation shows the number of...Ch. 2.3 - Each year Forbes ranks the worlds most valuable...Ch. 2.3 - Refer to Table 2.12. a. Prepare a crosstabulation...Ch. 2.3 - The U.S. Department of Energys Fuel Economy Guide...Ch. 2.4 - The following 20 observations are for two...Ch. 2.4 - Consider the following data on two categorical...Ch. 2.4 - The following crosstabulation summarizes the data...Ch. 2.4 - A study on driving speed (miles per hour) and fuel...Ch. 2.4 - The Current Results website lists the average...Ch. 2.4 - People often wait until middle age to worry about...Ch. 2.4 - Smartphones are advanced mobile phones with...Ch. 2.4 - The Northwest regional manager of an outdoor...Ch. 2 - Approximately 1.5 million high school students...Ch. 2 - The DATAfile MedianHousehold contains the median...Ch. 2 - Data showing the population by state in millions...Ch. 2 - A startup companys ability to gain funding is a...Ch. 2 - Consumer complaints are frequently reported to the...Ch. 2 - The term Beta refers to a measure of a stocks...Ch. 2 - The U.S. Census Bureau serves as the leading...Ch. 2 - western University has only one womens softball...Ch. 2 - Fortune magazine publishes an annual survey of the...Ch. 2 - Table 2.18 shows a portion of the data for a...Ch. 2 - Refer to the data set in Table 2.18. a. Construct...Ch. 2 - Refer to the data set in Table 2.18. a. Construct...Ch. 2 - Refer to the data set in Table 2.18. a. Prepare a...Ch. 2 - Google has changed its strategy with regard to how...Ch. 2 - A zoo has categorized its visitors into three...Ch. 2 - Pelican Stores Pelican Stores, a division of...Ch. 2 - Motion Picture Industry The motion picture...Ch. 2 - Queen City Cincinnati, Ohio, also known as the...
Knowledge Booster


Learn more about
Need a deep-dive on the concept behind this application? Look no further. Learn more about this topic, statistics and related others by exploring similar questions and additional content below.Similar questions
- A well-known company predominantly makes flat pack furniture for students. Variability with the automated machinery means the wood components are cut with a standard deviation in length of 0.45 mm. After they are cut the components are measured. If their length is more than 1.2 mm from the required length, the components are rejected. a) Calculate the percentage of components that get rejected. b) In a manufacturing run of 1000 units, how many are expected to be rejected? c) The company wishes to install more accurate equipment in order to reduce the rejection rate by one-half, using the same ±1.2mm rejection criterion. Calculate the maximum acceptable standard deviation of the new process.arrow_forward5. Let X and Y be independent random variables and let the superscripts denote symmetrization (recall Sect. 3.6). Show that (X + Y) X+ys.arrow_forward8. Suppose that the moments of the random variable X are constant, that is, suppose that EX" =c for all n ≥ 1, for some constant c. Find the distribution of X.arrow_forward
- 9. The concentration function of a random variable X is defined as Qx(h) = sup P(x ≤ X ≤x+h), h>0. Show that, if X and Y are independent random variables, then Qx+y (h) min{Qx(h). Qr (h)).arrow_forward10. Prove that, if (t)=1+0(12) as asf->> O is a characteristic function, then p = 1.arrow_forward9. The concentration function of a random variable X is defined as Qx(h) sup P(x ≤x≤x+h), h>0. (b) Is it true that Qx(ah) =aQx (h)?arrow_forward
- 3. Let X1, X2,..., X, be independent, Exp(1)-distributed random variables, and set V₁₁ = max Xk and W₁ = X₁+x+x+ Isk≤narrow_forward7. Consider the function (t)=(1+|t|)e, ER. (a) Prove that is a characteristic function. (b) Prove that the corresponding distribution is absolutely continuous. (c) Prove, departing from itself, that the distribution has finite mean and variance. (d) Prove, without computation, that the mean equals 0. (e) Compute the density.arrow_forward1. Show, by using characteristic, or moment generating functions, that if fx(x) = ½ex, -∞0 < x < ∞, then XY₁ - Y2, where Y₁ and Y2 are independent, exponentially distributed random variables.arrow_forward
- 1. Show, by using characteristic, or moment generating functions, that if 1 fx(x): x) = ½exarrow_forward1990) 02-02 50% mesob berceus +7 What's the probability of getting more than 1 head on 10 flips of a fair coin?arrow_forward9. The concentration function of a random variable X is defined as Qx(h) sup P(x≤x≤x+h), h>0. = x (a) Show that Qx+b(h) = Qx(h).arrow_forward
arrow_back_ios
SEE MORE QUESTIONS
arrow_forward_ios
Recommended textbooks for you
 Functions and Change: A Modeling Approach to Coll...AlgebraISBN:9781337111348Author:Bruce Crauder, Benny Evans, Alan NoellPublisher:Cengage Learning
 Holt Mcdougal Larson Pre-algebra: Student Edition...AlgebraISBN:9780547587776Author:HOLT MCDOUGALPublisher:HOLT MCDOUGAL
 Glencoe Algebra 1, Student Edition, 9780079039897...AlgebraISBN:9780079039897Author:CarterPublisher:McGraw Hill
 Big Ideas Math A Bridge To Success Algebra 1: Stu...AlgebraISBN:9781680331141Author:HOUGHTON MIFFLIN HARCOURTPublisher:Houghton Mifflin Harcourt
 Trigonometry (MindTap Course List)TrigonometryISBN:9781337278461Author:Ron LarsonPublisher:Cengage Learning
Functions and Change: A Modeling Approach to Coll...
Algebra
ISBN:9781337111348
Author:Bruce Crauder, Benny Evans, Alan Noell
Publisher:Cengage Learning
Holt Mcdougal Larson Pre-algebra: Student Edition...
Algebra
ISBN:9780547587776
Author:HOLT MCDOUGAL
Publisher:HOLT MCDOUGAL
Glencoe Algebra 1, Student Edition, 9780079039897...
Algebra
ISBN:9780079039897
Author:Carter
Publisher:McGraw Hill
Big Ideas Math A Bridge To Success Algebra 1: Stu...
Algebra
ISBN:9781680331141
Author:HOUGHTON MIFFLIN HARCOURT
Publisher:Houghton Mifflin Harcourt
Trigonometry (MindTap Course List)
Trigonometry
ISBN:9781337278461
Author:Ron Larson
Publisher:Cengage Learning
Correlation Vs Regression: Difference Between them with definition & Comparison Chart; Author: Key Differences;https://www.youtube.com/watch?v=Ou2QGSJVd0U;License: Standard YouTube License, CC-BY
Correlation and Regression: Concepts with Illustrative examples; Author: LEARN & APPLY : Lean and Six Sigma;https://www.youtube.com/watch?v=xTpHD5WLuoA;License: Standard YouTube License, CC-BY