
Statistics for Business & Economics
16th Edition
ISBN: 9781337325448
Author: Anderson
Publisher: CENGAGE C
expand_more
expand_more
format_list_bulleted
Concept explainers
Videos
Textbook Question
Chapter 2.1, Problem 4E
for the 2010–2011 viewing season, the top five syndicated programs were wheel of Fortune (WoF), Two and Half Men (THM), Jeopardy (Jep), Judge Judy (JJ), and the oprah winfrey Show (OWS) (Nielsen Media Research website, April 16, 2012). Data indicating the preferred shows for a sample of 50 viewers follow.
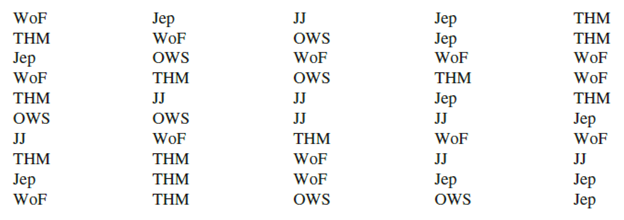
- a. Are these data categorical or quantitative?
- b. Provide frequency and percent frequency distributions.
- c. Construct a bar chart and a pie chart.
- d. On the basis of the sample, which television show has the largest viewing audience? Which one is second?
Expert Solution & Answer

Trending nowThis is a popular solution!

Students have asked these similar questions
Draw a picture of a normal distribution with
mean 70 and standard deviation 5.
What do you guess are the standard deviations of the two distributions in the previous example problem?
Please answer the questions
Chapter 2 Solutions
Statistics for Business & Economics
Ch. 2.1 - Methods 1. The response to a question has three...Ch. 2.1 - A partial relative frequency distribution is...Ch. 2.1 - A questionnaire provides 58 Yes, 42 No, and 20...Ch. 2.1 - for the 20102011 viewing season, the top five...Ch. 2.1 - In alphabetical order, the six most common last...Ch. 2.1 - Nielsen Media Research provided the list of the 25...Ch. 2.1 - The Canmark Research Center Airport Customer...Ch. 2.1 - Data for a sample of 55 members of the Baseball...Ch. 2.1 - Nearly 1.8 million bachelors degrees and over...Ch. 2.1 - VirtualTourist provides ratings for hotels...
Ch. 2.2 - Consider the following data. a. Develop a...Ch. 2.2 - Consider the following frequency distribution....Ch. 2.2 - Construct a histogram for the data in exercise 12.Ch. 2.2 - Consider the following data. a. Construct a dot...Ch. 2.2 - Construct a stem-and-leaf display for the...Ch. 2.2 - Construct a stem-and-leaf display for the...Ch. 2.2 - Applications A doctors office staff studied the...Ch. 2.2 - CBSSports.com developed the Total Player Ratings...Ch. 2.2 - Based on the tons handled in a year, the ports...Ch. 2.2 - The London School of Economics and the Harvard...Ch. 2.2 - Fortune provides a list of Americas largest...Ch. 2.2 - entrepreneur magazine ranks franchises using...Ch. 2.2 - The DATAfile EngineeringSalary contains the median...Ch. 2.2 - Each year America.EDU ranks the best paying...Ch. 2.2 - The 2011 Cincinnati Flying Pig Half-Marathon (13.1...Ch. 2.3 - The following data are for 30 observations...Ch. 2.3 - The following observations are for two...Ch. 2.3 - The Daytona 500 is a 500-mile automobile race held...Ch. 2.3 - The following crosstabulation shows the average...Ch. 2.3 - Recently, management at Oak Tree Golf Course...Ch. 2.3 - The following crosstabulation shows the number of...Ch. 2.3 - Each year Forbes ranks the worlds most valuable...Ch. 2.3 - Refer to Table 2.12. a. Prepare a crosstabulation...Ch. 2.3 - The U.S. Department of Energys Fuel Economy Guide...Ch. 2.4 - The following 20 observations are for two...Ch. 2.4 - Consider the following data on two categorical...Ch. 2.4 - The following crosstabulation summarizes the data...Ch. 2.4 - A study on driving speed (miles per hour) and fuel...Ch. 2.4 - The Current Results website lists the average...Ch. 2.4 - People often wait until middle age to worry about...Ch. 2.4 - Smartphones are advanced mobile phones with...Ch. 2.4 - The Northwest regional manager of an outdoor...Ch. 2 - Approximately 1.5 million high school students...Ch. 2 - The DATAfile MedianHousehold contains the median...Ch. 2 - Data showing the population by state in millions...Ch. 2 - A startup companys ability to gain funding is a...Ch. 2 - Consumer complaints are frequently reported to the...Ch. 2 - The term Beta refers to a measure of a stocks...Ch. 2 - The U.S. Census Bureau serves as the leading...Ch. 2 - western University has only one womens softball...Ch. 2 - Fortune magazine publishes an annual survey of the...Ch. 2 - Table 2.18 shows a portion of the data for a...Ch. 2 - Refer to the data set in Table 2.18. a. Construct...Ch. 2 - Refer to the data set in Table 2.18. a. Construct...Ch. 2 - Refer to the data set in Table 2.18. a. Prepare a...Ch. 2 - Google has changed its strategy with regard to how...Ch. 2 - A zoo has categorized its visitors into three...Ch. 2 - Pelican Stores Pelican Stores, a division of...Ch. 2 - Motion Picture Industry The motion picture...Ch. 2 - Queen City Cincinnati, Ohio, also known as the...
Knowledge Booster


Learn more about
Need a deep-dive on the concept behind this application? Look no further. Learn more about this topic, statistics and related others by exploring similar questions and additional content below.Similar questions
- 30. An individual who has automobile insurance from a certain company is randomly selected. Let Y be the num- ber of moving violations for which the individual was cited during the last 3 years. The pmf of Y isy | 1 2 4 8 16p(y) | .05 .10 .35 .40 .10 a.Compute E(Y).b. Suppose an individual with Y violations incurs a surcharge of $100Y^2. Calculate the expected amount of the surcharge.arrow_forward24. An insurance company offers its policyholders a num- ber of different premium payment options. For a ran- domly selected policyholder, let X = the number of months between successive payments. The cdf of X is as follows: F(x)=0.00 : x < 10.30 : 1≤x<30.40 : 3≤ x < 40.45 : 4≤ x <60.60 : 6≤ x < 121.00 : 12≤ x a. What is the pmf of X?b. Using just the cdf, compute P(3≤ X ≤6) and P(4≤ X).arrow_forward59. At a certain gas station, 40% of the customers use regular gas (A1), 35% use plus gas (A2), and 25% use premium (A3). Of those customers using regular gas, only 30% fill their tanks (event B). Of those customers using plus, 60% fill their tanks, whereas of those using premium, 50% fill their tanks.a. What is the probability that the next customer will request plus gas and fill the tank (A2 B)?b. What is the probability that the next customer fills the tank?c. If the next customer fills the tank, what is the probability that regular gas is requested? Plus? Premium?arrow_forward
- 38. Possible values of X, the number of components in a system submitted for repair that must be replaced, are 1, 2, 3, and 4 with corresponding probabilities .15, .35, .35, and .15, respectively. a. Calculate E(X) and then E(5 - X).b. Would the repair facility be better off charging a flat fee of $75 or else the amount $[150/(5 - X)]? [Note: It is not generally true that E(c/Y) = c/E(Y).]arrow_forward74. The proportions of blood phenotypes in the U.S. popula- tion are as follows:A B AB O .40 .11 .04 .45 Assuming that the phenotypes of two randomly selected individuals are independent of one another, what is the probability that both phenotypes are O? What is the probability that the phenotypes of two randomly selected individuals match?arrow_forward53. A certain shop repairs both audio and video compo- nents. Let A denote the event that the next component brought in for repair is an audio component, and let B be the event that the next component is a compact disc player (so the event B is contained in A). Suppose that P(A) = .6 and P(B) = .05. What is P(BA)?arrow_forward
- 26. A certain system can experience three different types of defects. Let A;(i = 1,2,3) denote the event that the sys- tem has a defect of type i. Suppose thatP(A1) = .12 P(A) = .07 P(A) = .05P(A, U A2) = .13P(A, U A3) = .14P(A2 U A3) = .10P(A, A2 A3) = .011Rshelfa. What is the probability that the system does not havea type 1 defect?b. What is the probability that the system has both type 1 and type 2 defects?c. What is the probability that the system has both type 1 and type 2 defects but not a type 3 defect? d. What is the probability that the system has at most two of these defects?arrow_forwardThe following are suggested designs for group sequential studies. Using PROCSEQDESIGN, provide the following for the design O’Brien Fleming and Pocock.• The critical boundary values for each analysis of the data• The expected sample sizes at each interim analysisAssume the standardized Z score method for calculating boundaries.Investigators are evaluating the success rate of a novel drug for treating a certain type ofbacterial wound infection. Since no existing treatment exists, they have planned a one-armstudy. They wish to test whether the success rate of the drug is better than 50%, whichthey have defined as the null success rate. Preliminary testing has estimated the successrate of the drug at 55%. The investigators are eager to get the drug into production andwould like to plan for 9 interim analyses (10 analyzes in total) of the data. Assume thesignificance level is 5% and power is 90%.Besides, draw a combined boundary plot (OBF, POC, and HP)arrow_forwardPlease provide the solution for the attached image in detailed.arrow_forward
- 20 km, because GISS Worksheet 10 Jesse runs a small business selling and delivering mealie meal to the spaza shops. He charges a fixed rate of R80, 00 for delivery and then R15, 50 for each packet of mealle meal he delivers. The table below helps him to calculate what to charge his customers. 10 20 30 40 50 Packets of mealie meal (m) Total costs in Rands 80 235 390 545 700 855 (c) 10.1. Define the following terms: 10.1.1. Independent Variables 10.1.2. Dependent Variables 10.2. 10.3. 10.4. 10.5. Determine the independent and dependent variables. Are the variables in this scenario discrete or continuous values? Explain What shape do you expect the graph to be? Why? Draw a graph on the graph provided to represent the information in the table above. TOTAL COST OF PACKETS OF MEALIE MEAL 900 800 700 600 COST (R) 500 400 300 200 100 0 10 20 30 40 60 NUMBER OF PACKETS OF MEALIE MEALarrow_forwardLet X be a random variable with support SX = {−3, 0.5, 3, −2.5, 3.5}. Part ofits probability mass function (PMF) is given bypX(−3) = 0.15, pX(−2.5) = 0.3, pX(3) = 0.2, pX(3.5) = 0.15.(a) Find pX(0.5).(b) Find the cumulative distribution function (CDF), FX(x), of X.1(c) Sketch the graph of FX(x).arrow_forwardA well-known company predominantly makes flat pack furniture for students. Variability with the automated machinery means the wood components are cut with a standard deviation in length of 0.45 mm. After they are cut the components are measured. If their length is more than 1.2 mm from the required length, the components are rejected. a) Calculate the percentage of components that get rejected. b) In a manufacturing run of 1000 units, how many are expected to be rejected? c) The company wishes to install more accurate equipment in order to reduce the rejection rate by one-half, using the same ±1.2mm rejection criterion. Calculate the maximum acceptable standard deviation of the new process.arrow_forward
arrow_back_ios
SEE MORE QUESTIONS
arrow_forward_ios
Recommended textbooks for you
 Big Ideas Math A Bridge To Success Algebra 1: Stu...AlgebraISBN:9781680331141Author:HOUGHTON MIFFLIN HARCOURTPublisher:Houghton Mifflin Harcourt
 Glencoe Algebra 1, Student Edition, 9780079039897...AlgebraISBN:9780079039897Author:CarterPublisher:McGraw Hill
 Holt Mcdougal Larson Pre-algebra: Student Edition...AlgebraISBN:9780547587776Author:HOLT MCDOUGALPublisher:HOLT MCDOUGAL
Big Ideas Math A Bridge To Success Algebra 1: Stu...
Algebra
ISBN:9781680331141
Author:HOUGHTON MIFFLIN HARCOURT
Publisher:Houghton Mifflin Harcourt
Glencoe Algebra 1, Student Edition, 9780079039897...
Algebra
ISBN:9780079039897
Author:Carter
Publisher:McGraw Hill
Holt Mcdougal Larson Pre-algebra: Student Edition...
Algebra
ISBN:9780547587776
Author:HOLT MCDOUGAL
Publisher:HOLT MCDOUGAL
The Shape of Data: Distributions: Crash Course Statistics #7; Author: CrashCourse;https://www.youtube.com/watch?v=bPFNxD3Yg6U;License: Standard YouTube License, CC-BY
Shape, Center, and Spread - Module 20.2 (Part 1); Author: Mrmathblog;https://www.youtube.com/watch?v=COaid7O_Gag;License: Standard YouTube License, CC-BY
Shape, Center and Spread; Author: Emily Murdock;https://www.youtube.com/watch?v=_YyW0DSCzpM;License: Standard Youtube License