
Concept explainers
Videos
Queen City
Cincinnati, Ohio, also known as the Queen City, has a population of approximately 298.000 and is the third largest city in the state of Ohio. The Cincinnati metropolitan area has a population of about 2.2 million. The city is governed by a mayor and a nine-member city council. The city manager, who is responsible for the day-to-day operation of the city, reports to the mayor and city council. The city manager recently created the Office of Performance and Data Analytics with the goal of improving the efficiency of city operations.
TABLE 2.21 ANNUAL EXPENDITURES FOR QUEEN CITY (FIRST FOUR ENTRIES)
One of the first tasks of this new office is to review the previous year’s expenditures. The file QueenCity contains data on the previous year’s expenditures, including the following:
Department The number of the department incurring the expenditure
Department Description The name of the department incurring the description
Category The category of the expenditure
Fund The fund to which the expenditure was charged
Expenditure The dollar amount of the expense
Table 2.21 shows the first four entries of the 5427 expenditures for the year. The city manager would like to use this data to better understand how the city’s budget is being spent.
Managerial Report
Use tabular and graphical methods of
- 1. Tables and/or graphical displays that show the amount of expenditures by category and percentage of total expenditures by category.
- 2. A table that shows the amount of expenditures by department and the percentage of total expenditures by department. Combine any department with less than 1% into a category named “Other.”
- 3. A table that shows the amount of expenditures by fund and the percentage of total expenditures by fund. Combine any fund with less than 1 % into a category named “Other.”
1.
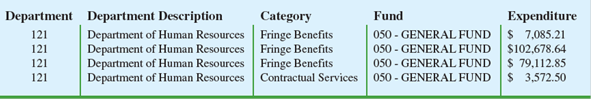
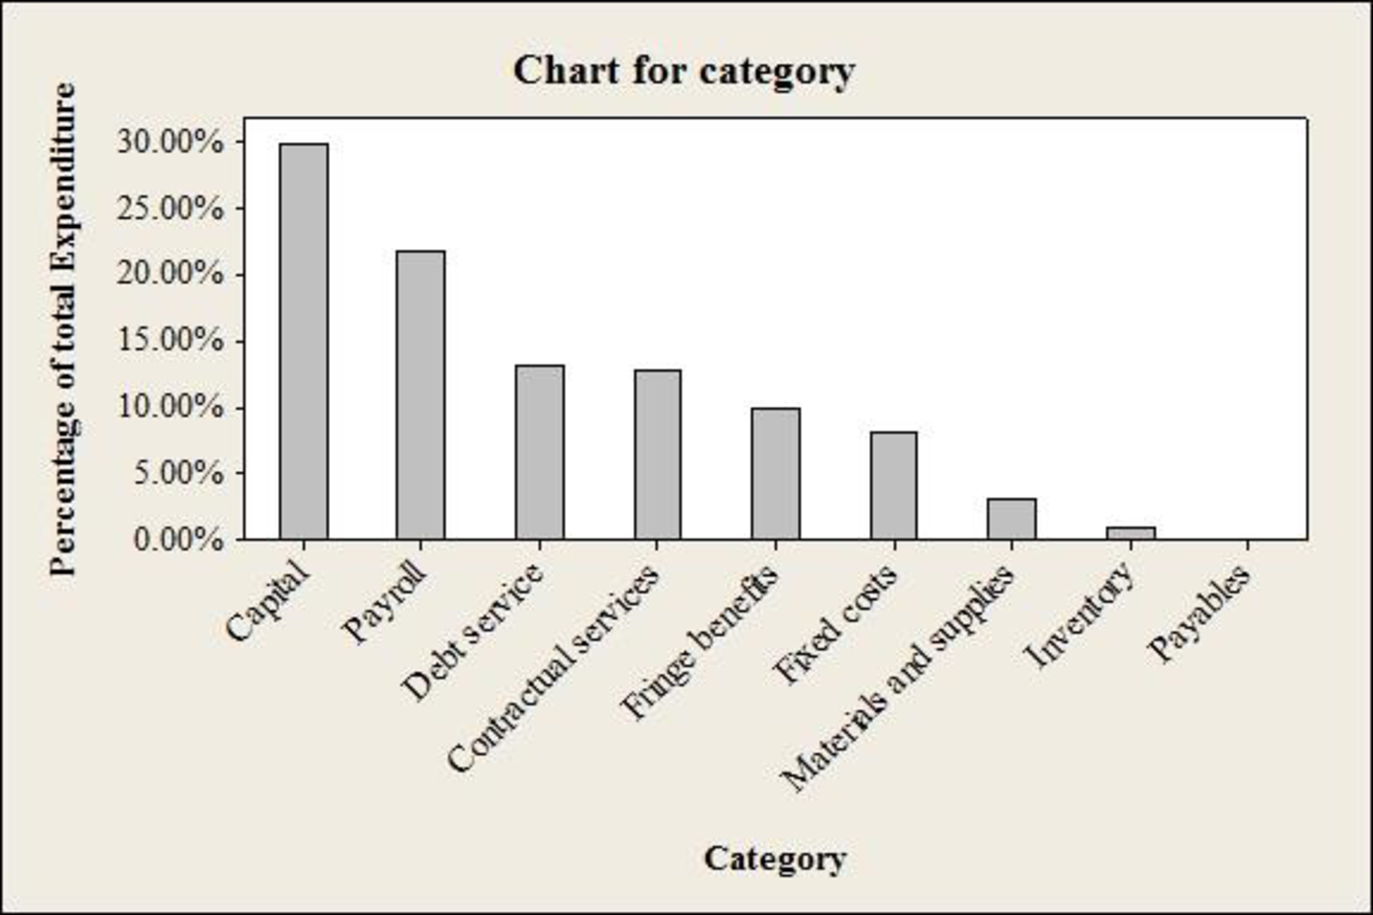
Make tabular and graphical displays that show the amount of expenditure by category and percentage of total expenditures by category.
Answer to Problem 3CP
The table represents the total amount of expenditure by category and percentage of total expenditures by category.
| Category | Total Expenditure | Percentage of total Expenditure |
| Capital | $198,365,854 | 29.98% |
| Payroll | $145,017,555 | 21.92% |
| Debt service | $86,913,978 | 13.14% |
| Contractual services | $85,043,249 | 12.85% |
| Fringe benefits | $66,053,340 | 9.98% |
| Fixed costs | $53,732,177 | 8.12% |
| Materials and supplies | $19,934,710 | 3.01% |
| Inventory | $6,393,394 | 0.97% |
| Payables | $180,435 | 0.03% |
| Grand Total | $661,634,693 | 100.0% |
The bar chart for “Category” is given below:
Explanation of Solution
Calculation:
The table represents the sample of 5,427 entries annual expenditures for queen city (Cincinnati, Ohio) for the year. The five types of variables present in the data are department serial number, department description, category name, fund and expenditure.
From the data set, the variable “Category” consists of nine entities namely capital, payroll, debt service, contractual services, fringe benefits, fixed costs, Materials and supplies, inventory and payable.
Therefore, the following table shows the amount of all nine entities total expenditure by category.
| Category | Total Expenditure |
| Capital | $198,365,854 |
| Payroll | $145,017,555 |
| Debt service | $86,913,978 |
| Contractual services | $85,043,249 |
| Fringe benefits | $66,053,340 |
| Fixed costs | $53,732,177 |
| Materials and supplies | $19,934,710 |
| Inventory | $6,393,394 |
| Payables | $180,435 |
| Grand Total | $661,634,693 |
The percentage for capital is calculated as the ratio of total expenditure for capital to the grand totals of all categories.
The following table shows the percentage of amount of all nine entities total expenditure by category:
| Category | Total Expenditure | Percentage of total Expenditure |
| Capital | $198,365,854 | 29.98% |
| Payroll | $145,017,555 | 21.92% |
| Debt service | $86,913,978 | 13.14% |
| Contractual services | $85,043,249 | 12.85% |
| Fringe benefits | $66,053,340 | 9.98% |
| Fixed costs | $53,732,177 | 8.12% |
| Materials and supplies | $19,934,710 | 3.01% |
| Inventory | $6,393,394 | 0.97% |
| Payables | $180,435 | 0.03% |
| Grand Total | $661,634,693 | 100.0% |
Software procedure:
Step-by-step software procedure to obtain bar chart for category using MINITAB software is as follows:
- From Bars represent, choose Values from a table.
- UnderOne column of values, choose Simple. Click OK.
- Choose Simple, and then click OK.
- In Graph variables, enter the column of percent frequency for total expenditure.
- In Categorical variables, enter the column of entities of category.
- Click OK.
Output using the MINITAB software is given below:
From the obtained table and bar chart, it is observed that the Capital expenditures and payroll account for over 50% of all expenditures.
Also, the total expenditures are over $660 million. Debt Service seems to be high, and it is found to be over 10% of total expenditures.
2.
Make tabular displays that show the amount of expenditure by department and percentage of total expenditures by department.
Answer to Problem 3CP
The table represents the total amount of expenditure by department and percentage of total expenditures by department.
| Department Description | Percentage of total Expenditure | Total Expenditure |
| Department of Police | 9.72% | 64,295,941 |
| Department of Sewers | 8.76% | 57,954,955 |
| Transportation and Engineering, Engineering | 8.72% | 57,686,199 |
| Department of Fire | 7.23% | 47,838,396 |
| Sewers, Debt Service | 6.59% | 43,585,814 |
| Finance, Risk Management | 5.39% | 35,654,238 |
| SORTA Operations | 3.62% | 23,975,000 |
| Water Works, Debt Service | 3.24% | 21,418,102 |
| Department of Water Works | 3.07% | 20,307,505 |
| Finance, Treasury | 2.80% | 18,531,650 |
| Economic Development | 2.13% | 14,078,735 |
| Division of Parking Facilities | 1.89% | 12,489,731 |
| Community Development, Housing | 1.75% | 11,556,943 |
| Enterprise Technology Solutions | 1.71% | 11,314,215 |
| Public Services, Fleet Services | 1.66% | 10,982,312 |
| Finance, Accounts & Audits | 1.66% | 10,960,345 |
| Transportation and Engineering, Planning | 1.63% | 10,764,138 |
| Public Services, Neighborhood Operations | 1.38% | 9,140,769 |
| Sewers, Millcreek | 1.30% | 8,575,226 |
| Health, Primary Health Care Centers | 1.25% | 8,268,632 |
| Water Works, Water Supply | 1.19% | 7,883,099 |
| Public Services, Facilities Management | 1.13% | 7,469,863 |
| Sewers, Wastewater Administration | 1.01% | 6,668,240 |
| Other department less than 1 percent each | 21.2% | 1,40,234,644 |
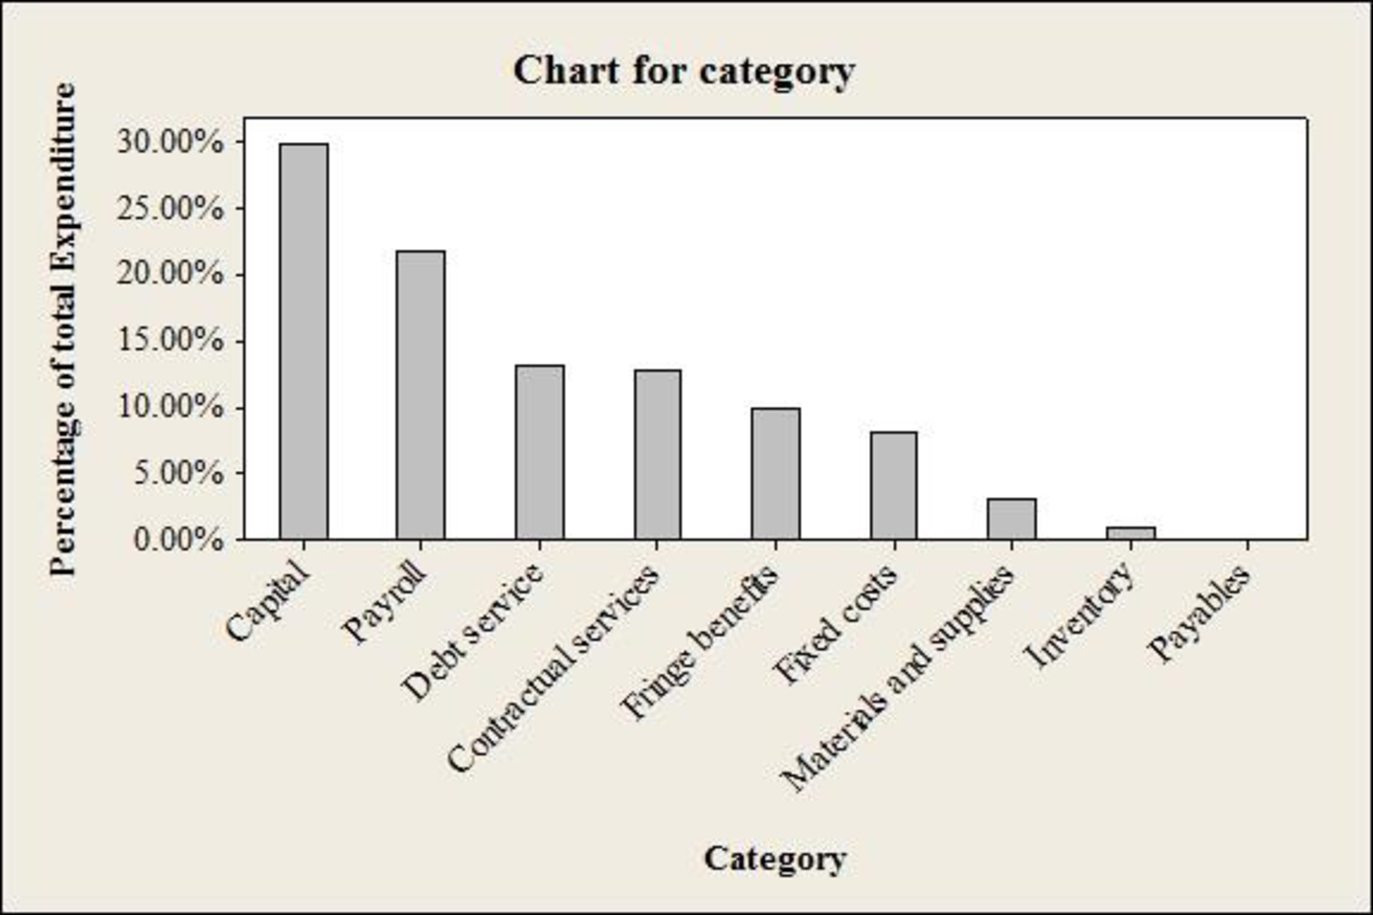
The bar chart for “Department description” is given below:
Explanation of Solution
Calculation:
Here, any departments with less than 1% are combined into a category named “other”.
Department descriptionwith less than 1% is tabulated as follows with named as “other”:
| Other (department description less than 1%) | Percentage of total Expenditure | Total Expenditure |
| Water Works, Distribution | 0.98% | 64,90,554 |
| Public Services, Traffic and Road Operations | 0.89% | 58,84,799 |
| Parks, Administrative and Program Services | 0.87% | 57,44,316 |
| Water Works, Commercial Services | 0.81% | 53,60,380 |
| Sewers, Wastewater Collection | 0.81% | 53,31,756 |
| Sewers, Director/Stormwater | 0.79% | 52,13,170 |
| Parks, Operations and Facility Mgmt | 0.76% | 50,08,200 |
| Police Emergency Communications | 0.69% | 45,57,589 |
| Division of Convention Center | 0.67% | 44,60,267 |
| Health, Primary Health Care Programs | 0.58% | 38,21,334 |
| Health, Community Health Services | 0.56% | 36,75,649 |
| Sewers, Maintenance | 0.55% | 36,68,040 |
| Water Works, Water Quality and Treatment | 0.51% | 33,95,988 |
| Recreation, Support Services | 0.50% | 33,15,938 |
| Law Department | 0.47% | 30,78,594 |
| Recreation, Golf | 0.42% | 27,81,652 |
| Water Works, Business Services | 0.41% | 26,93,873 |
| New Construction & Building Standards | 0.40% | 26,77,798 |
| Water Works, Engineering | 0.39% | 25,83,805 |
| Division of Traffic Engineering | 0.38% | 25,04,453 |
| Cincinnati Public School Reserve | 0.38% | 25,00,000 |
| Sewers, Little Miami | 0.37% | 24,39,869 |
| Planning, Licenses & Permits | 0.36% | 23,71,973 |
| Workers' Compensation Insuranced | 0.33% | 22,14,094 |
| Motorized and Construction Equipment | 0.33% | 21,87,298 |
| Recreation, Maintenance | 0.33% | 21,62,545 |
| General Fund Overhead | 0.32% | 20,95,756 |
| Health, Primary School &Adolesent | 0.31% | 20,74,254 |
| Community Development Administration | 0.30% | 19,68,773 |
| Sewers, Industrial Waste | 0.28% | 18,41,374 |
| Office of the City Manager | 0.26% | 17,12,437 |
| Sewers, Project Delivery | 0.25% | 16,82,688 |
| Finance, Purchasing | 0.24% | 16,00,148 |
| Recreation, Athletics | 0.24% | 15,82,290 |
| Office of Environmental Qualities | 0.23% | 15,48,437 |
| Recreation, West Region | 0.22% | 14,87,931 |
| Finance, Income Tax | 0.22% | 14,83,479 |
| Health, Commissioner | 0.21% | 14,18,825 |
| Recreation, Central Region | 0.21% | 13,93,663 |
| Recreation, East Region | 0.20% | 13,50,682 |
| Community Development | 0.20% | 13,37,001 |
| Sewers, Muddy Creek | 0.18% | 12,11,584 |
| Health, Technical Resources | 0.17% | 11,22,229 |
| Sewers, Planning | 0.17% | 10,92,095 |
| Enterprise Software and Licenses | 0.16% | 10,82,024 |
| Water Works, IT | 0.16% | 10,39,488 |
| Sewers, Wastewater Engineering | 0.15% | 9,73,882 |
| Department of Human Resources | 0.14% | 9,29,460 |
| Department Of Planning & Buildings | 0.14% | 9,11,988 |
| Office and Technical Equipment | 0.13% | 8,63,762 |
| Bond Fund - Principal and Interest | 0.12% | 7,74,523 |
| Sewers, Sycamore | 0.11% | 7,54,132 |
| Transportation and Engineering Director | 0.11% | 7,20,092 |
| Division of Aviation | 0.11% | 7,02,480 |
| Budget & Evaluation | 0.08% | 5,62,270 |
| Sewers, Polk Run | 0.08% | 5,32,890 |
| Sewers, Taylor Creek | 0.08% | 5,29,774 |
| Citizens' Complaint Authority | 0.07% | 4,31,449 |
| Sewers, Superintendent | 0.06% | 4,28,268 |
| Contribution to Fire Pension | 0.06% | 4,16,783 |
| Contribution to Police Pension | 0.06% | 4,00,439 |
| Public Services, Director | 0.06% | 3,97,815 |
| Port Authority Greater Cincinnati Development | 0.05% | 3,50,000 |
| City Council | 0.05% | 3,37,658 |
| Hamilton Co. Auditor & Treasurer Fees | 0.05% | 2,98,758 |
| Office of The Clerk of Council | 0.04% | 2,93,185 |
| Office of The Mayor | 0.04% | 2,87,622 |
| Lump Sum Payments | 0.04% | 2,52,054 |
| Finance Director’s Office | 0.03% | 2,13,548 |
| County Clerk Fees | 0.03% | 1,75,000 |
| Public Employees Assistance Program | 0.02% | 1,61,711 |
| Police and Fire Fighter's Insurance | 0.02% | 1,15,000 |
| Parks, Office of Director | 0.01% | 94,987 |
| Special Investigations/Studies | 0.01% | 92,210 |
| Councilmember PG Sittenfeld | 0.01% | 77,451 |
| Surplus | 0.01% | 76,091 |
| Councilmember Y. Simpson | 0.01% | 70,985 |
| Councilmember W. Young | 0.01% | 63,012 |
| Councilmember R. Qualls | 0.01% | 62,862 |
| Councilmember C. Seelbach | 0.01% | 60,177 |
| Councilmember Quinlivan | 0.01% | 57,685 |
| Councilmember C. Winburn | 0.01% | 57,654 |
| Downtown Special Inprovement District | 0.01% | 56,000 |
| Memberships & Publications | 0.01% | 53,150 |
| Cincinnati Music Hall | 0.01% | 50,000 |
| Election Expense | 0.01% | 46,580 |
| Convention Facility Authority | 0.01% | 45,700 |
| Councilmember C. Thomas | 0.01% | 45,603 |
| Councilmember C. Smitherman | 0.01% | 43,141 |
| Mayor's Office Obligations | 0.01% | 41,194 |
| State Unemployment Comp | 0.00% | 31,671 |
| Manager's Office Obligations | 0.00% | 13,956 |
| Councilmember P. Thomas | 0.00% | 13,168 |
| Judgments Against the City | 0.00% | 7,644 |
| Department of Public Recreation | 0.00% | 5,093 |
| Audit & Examiners Fees | 0.00% | 5,000 |
From the data set, the variable “department description” has 119 different departments out of which 96 departments whose percentage is less than 1.
Therefore, the following table shows the expenditure of all 119 different departments.
| Department Description | Total Expenditure |
| Department of Police | 64,295,941 |
| Department of Sewers | 57,954,955 |
| Transportation and Engineering, Engineering | 57,686,199 |
| Department of Fire | 47,838,396 |
| Sewers, Debt Service | 43,585,814 |
| Finance, Risk Management | 35,654,238 |
| SORTA Operations | 23,975,000 |
| Water Works, Debt Service | 21,418,102 |
| Department of Water Works | 20,307,505 |
| Finance, Treasury | 18,531,650 |
| Economic Development | 14,078,735 |
| Division of Parking Facilities | 12,489,731 |
| Community Development, Housing | 11,556,943 |
| Enterprise Technology Solutions | 11,314,215 |
| Public Services, Fleet Services | 10,982,312 |
| Finance, Accounts & Audits | 10,960,345 |
| Transportation and Engineering, Planning | 10,764,138 |
| Public Services, Neighborhood Operations | 9,140,769 |
| Sewers, Millcreek | 8,575,226 |
| Health, Primary Health Care Centers | 8,268,632 |
| Water Works, Water Supply | 7,883,099 |
| Public Services, Facilities Management | 7,469,863 |
| Sewers, Wastewater Administration | 6,668,240 |
| Other department less than 1 percent each | 140,234,644 |
| Grand Total | 661,634,692 |
The percentage for department description is calculated as the ratio of total expenditure to the grand totals all departments.
Therefore, the following table shows the percentage of amount of all department total expenditure by department.
| Department Description | Percentage of total Expenditure |
| Department of Police | 9.72% |
| Department of Sewers | 8.76% |
| Transportation and Engineering, Engineering | 8.72% |
| Department of Fire | 7.23% |
| Sewers, Debt Service | 6.59% |
| Finance, Risk Management | 5.39% |
| SORTA Operations | 3.62% |
| Water Works, Debt Service | 3.24% |
| Department of Water Works | 3.07% |
| Finance, Treasury | 2.80% |
| Economic Development | 2.13% |
| Division of Parking Facilities | 1.89% |
| Community Development, Housing | 1.75% |
| Enterprise Technology Solutions | 1.71% |
| Public Services, Fleet Services | 1.66% |
| Finance, Accounts & Audits | 1.66% |
| Transportation and Engineering, Planning | 1.63% |
| Public Services, Neighborhood Operations | 1.38% |
| Sewers, Millcreek | 1.30% |
| Health, Primary Health Care Centers | 1.25% |
| Water Works, Water Supply | 1.19% |
| Public Services, Facilities Management | 1.13% |
| Sewers, Wastewater Administration | 1.01% |
| Other department less than 1 percent each | 21.2% |
Software procedure:
Step-by-step software procedure to obtain bar chart for category using MINITAB software is as follows:
- From Bars represent, choose Values from a table.
- Under One column of values, choose Simple. Click OK.
- Choose Simple, and then click OK.
- In Graph variables, enter the column of percent frequency for total expenditure in department.
- In Categorical variables, enter the column of entities of department
- Click OK.
Output using the MINITAB software is given below:

Interpretation:
- From the obtained table and bar chart, it is observed that, 96 departments showing total expenditure as less than 1% over 119 departments.
- There are six individual departments namely police, sewers, transportation Engineering, Fire, sewer debt service and financial/Risk management has total expenditure approximately 5 percent and more.
- Further, other department less than 1 percent each seems to be high, in terms of total expenditure percentage.
c.
Make tabular displays that show the amount of expenditure by fund and percentage of total expenditures by fund and Combine any department with less than 1% into a category named “other”.
Answer to Problem 3CP
The table represents the total amount of expenditure by Fund and percentage of total expenditures by Fund.
| Fund | Total expenditure | percentage of total expenditure |
| 050 - general fund | 16,86,07,659 | 25.5% |
| 980 - capital projects | 10,61,80,470 | 16.0% |
| 701 - metropolitan sewer district of greater cincinnati | 8,37,13,741 | 12.7% |
| 704 - metropolitan sewer district capital improvements | 5,79,54,955 | 8.8% |
| 101 - water works | 5,22,92,202 | 7.9% |
| 711 - risk management | 3,23,80,425 | 4.9% |
| 759 - income tax - transit | 2,42,39,259 | 3.7% |
| 151 - bond retirement - city | 1,55,84,916 | 2.4% |
| 202 - fleet services | 1,09,94,649 | 1.7% |
| 898 - water works improvement 12 | 84,83,304 | 1.3% |
| 897 - water works improvement 11 | 84,34,379 | 1.3% |
| 302 - income tax - infrastructure | 71,02,773 | 1.1% |
| other (less than 1% each) | 8,56,65,960 | 12.9% |
| Grand Total | 66,16,34,693 | 100.0% |
The bar chart for “Fund” is given below:

Explanation of Solution
Calculation:
Fund with less than 1% is tabulated as follows with named as “other”:
| Other (Fund less than 1%) | Total Expenditure | Percentage of total expenditure |
| 155 – u square revenue bonds -trustee | 47,48,810 | 0.80% |
| 304 - community development block grant | 46,96,312 | 0.70% |
| 301 - street construction, maintenance and repair | 40,53,506 | 0.70% |
| 103 - duke energy convention center | 35,08,157 | 0.60% |
| 102 - parking system facilities | 33,88,305 | 0.50% |
| 702 - enterprise technology solutions | 32,16,237 | 0.50% |
| 762 - urban redevelopment tax increment equivalent | 28,16,029 | 0.50% |
| 105 - municipal golf activities | 25,96,303 | 0.40% |
| 395 - health services | 24,11,634 | 0.40% |
| 107 - stormwater management | 23,25,888 | 0.40% |
| 368 - law enforcement grant | 22,22,595 | 0.40% |
| 410 - shelter plus care program | 21,62,535 | 0.30% |
| 449 - cincinnati area geographic information system (cagis) | 21,59,283 | 0.30% |
| 353 - home health services | 20,99,548 | 0.30% |
| 457 - clear fund | 19,57,914 | 0.30% |
| 213 - worker''s compensation | 18,17,200 | 0.30% |
| 758 - income tax permanent improvement fund | 17,66,123 | 0.30% |
| 214 - water works stores - chemicals | 15,26,281 | 0.30% |
| 204 - water works stores - materials | 15,06,447 | 0.20% |
| 391 - women and infants food grant program | 14,26,434 | 0.20% |
| 472 - fire grants | 13,62,498 | 0.20% |
| 307 - convention center expansion tax | 12,96,800 | 0.20% |
| 212 - employee safety and risk management | 12,16,265 | 0.20% |
| 491 - municipal public improvement equivalent fund | 12,12,813 | 0.20% |
| 438 - neiborhood stabilization program | 12,11,603 | 0.20% |
| 795 - downtown special inprovement district | 12,02,786 | 0.20% |
| 201 - printing services/ stores | 11,41,805 | 0.20% |
| 306 - municipal motor vehicle license tax | 10,77,283 | 0.20% |
| 323 - recreation special activities | 10,69,119 | 0.20% |
| 411 - home investment trust | 9,91,223 | 0.20% |
| 349 - urban renewal debt retirement | 9,79,853 | 0.10% |
| 350 - public health research | 8,51,919 | 0.10% |
| 418 - federal health program income | 8,48,578 | 0.10% |
| 792 - forestry | 7,40,592 | 0.10% |
| 340 - centennial operations | 7,24,704 | 0.10% |
| 757 - miscellaneous permanent improvement fund | 6,62,729 | 0.10% |
| 104 - lunken airport | 5,86,663 | 0.10% |
| 487 - cuf/heights equivalent fund | 5,62,261 | 0.10% |
| 483 - downtown/otr east equivalent fund | 5,58,694 | 0.10% |
| 156 - fountain square west revenue bonds - trustee | 5,57,577 | 0.10% |
| 412 - food service license fees | 5,50,645 | 0.10% |
| 369 - criminal activity forfeiture - state | 5,23,925 | 0.10% |
| 488 –corryville equivalent fund | 5,19,767 | 0.10% |
| 502 - arra federal grants | 5,09,814 | 0.10% |
| 445 - emergency shelter | 4,53,541 | 0.10% |
| 465 - housing opportunities for persons with aids | 3,73,929 | 0.10% |
| 498 –maidisonvill equivalent fund | 3,63,449 | 0.10% |
| 332 - krohn conservatory | 3,02,862 | 0.10% |
| 364 - 911 cell phone fees | 2,99,652 | 0.00% |
| 381 - cincinnati abatement project | 2,84,022 | 0.00% |
| 317 - urban development - property operations | 2,28,247 | 0.00% |
| 461 - fema grant | 2,19,424 | 0.00% |
| 793 - boulevard light energy and maintenance (blem) | 1,83,378 | 0.00% |
| 324 - recreation federal grant projects | 1,78,387 | 0.00% |
| 166 - graeters revenue bonds - trustee | 1,76,113 | 0.00% |
| 326 - park donations and special activity | 1,71,770 | 0.00% |
| 210 - highway maintenance stores | 1,69,814 | 0.00% |
| 342 - new city buildings operations | 1,67,023 | 0.00% |
| 420 - public employee assistance program | 1,65,141 | 0.00% |
| 446 - health network | 1,64,337 | 0.00% |
| 209 - property management | 1,62,435 | 0.00% |
| 618 - towing charges - private operators | 1,50,000 | 0.00% |
| 314 - special events | 1,46,679 | 0.00% |
| 481 - downtown south/riverfront equivalent fund | 1,44,066 | 0.00% |
| 367 - criminal activity forfeiture - federal | 1,31,116 | 0.00% |
| 753 - expressways/gateways | 1,26,717 | 0.00% |
| 486 - east walnut hills equivalent fund | 1,25,855 | 0.00% |
| 499 - oakley equivalent fund | 1,23,924 | 0.00% |
| 436 - environmental studies | 1,22,482 | 0.00% |
| 318 - sawyer point | 1,15,771 | 0.00% |
| 330 - park lodge/pavilion deposits | 1,02,413 | 0.00% |
| 482 - downtown/otr west equivalent fund | 97,418 | 0.00% |
| 756 - water works capital | 78,225 | 0.00% |
| 485 - walnut hills equivalent fund | 77,402 | 0.00% |
| 207 - recreation stores | 76,091 | 0.00% |
| 161 - msd debt service - trustee - multi series | 71,262 | 0.00% |
| 752 - park board | 69,499 | 0.00% |
| 415 - immunization action plan | 63,781 | 0.00% |
| 478 - justice assistance grant | 56,049 | 0.00% |
| 425 - heart health in hamilton county project | 48,994 | 0.00% |
| 387 - lead hazard control research grant | 48,025 | 0.00% |
| 791 - sidewalks | 45,700 | 0.00% |
| 715 - convention facility authority | 44,830 | 0.00% |
| 454 –metrolpolitain medical response | 42,877 | 0.00% |
| 428 - urban forestry | 41,771 | 0.00% |
| 448 - health care services for the homeless | 41,475 | 0.00% |
| 370 - drug offender fines | 39,325 | 0.00% |
| 363 - solid waste disposal control | 38,714 | 0.00% |
| 490 - evanston equivalent fund | 37,825 | 0.00% |
| 354 - household sewage treatment fees | 35,989 | 0.00% |
| 380 - lead poisoning control | 35,194 | 0.00% |
| 394 - state health program income | 29,632 | 0.00% |
| 413 - swimming pool license fees | 26,801 | 0.00% |
| 476 - uasi grant | 25,094 | 0.00% |
| 405 - market facilities | 24,099 | 0.00% |
| 389 - communications and marketing activities | 22,805 | 0.00% |
| other (less than 1% each) | 85,665,960 | 12.9% |
From the above table, the other category has the total expenditure $85,665,960.
Therefore, the following table shows the amount of all 13 entities total expenditure by Fund.
| Fund | Total expenditure |
| 050 - general fund | 16,86,07,659 |
| 980 - capital projects | 10,61,80,470 |
| 701 - metropolitan sewer district of greater cincinnati | 8,37,13,741 |
| 704 - metropolitan sewer district capital improvements | 5,79,54,955 |
| 101 - water works | 5,22,92,202 |
| 711 - risk management | 3,23,80,425 |
| 759 - income tax - transit | 2,42,39,259 |
| 151 - bond retirement - city | 1,55,84,916 |
| 202 - fleet services | 1,09,94,649 |
| 898 - water works improvement 12 | 84,83,304 |
| 897 - water works improvement 11 | 84,34,379 |
| 302 - income tax - infrastructure | 71,02,773 |
| other (less than 1% each) | 8,56,65,960 |
| Total | 66,16,34,693 |
The percentage for fund is calculated as the ratio of total expenditure to the grand totals all funds.
Therefore, the following table shows the percentage of amount of all fund total expenditure by funds
| Fund | Percentage of total expenditure |
| 050 - general fund | 25.5% |
| 980 - capital projects | 16.0% |
| 701 - metropolitan sewer district of greater cincinnati | 12.7% |
| 704 - metropolitan sewer district capital improvements | 8.8% |
| 101 - water works | 7.9% |
| 711 - risk management | 4.9% |
| 759 - income tax - transit | 3.7% |
| 151 - bond retirement - city | 2.4% |
| 202 - fleet services | 1.7% |
| 898 - water works improvement 12 | 1.3% |
| 897 - water works improvement 11 | 1.3% |
| 302 - income tax - infrastructure | 1.1% |
| other (less than 1% each) | 12.9% |
| Total | 100.0% |
Software procedure:
Step-by-step software procedure to obtain bar chart for category using MINITAB software is as follows:
- From Bars represent, choose Values from a table.
- Under One column of values, choose Simple. Click OK.
- Choose Simple, and then click OK.
- In Graph variables, enter the column of percent frequency for total expenditure in funds.
- In Categorical variables, enter the column of entities of funds.
- Click OK.
Output using the MINITAB software is given below:
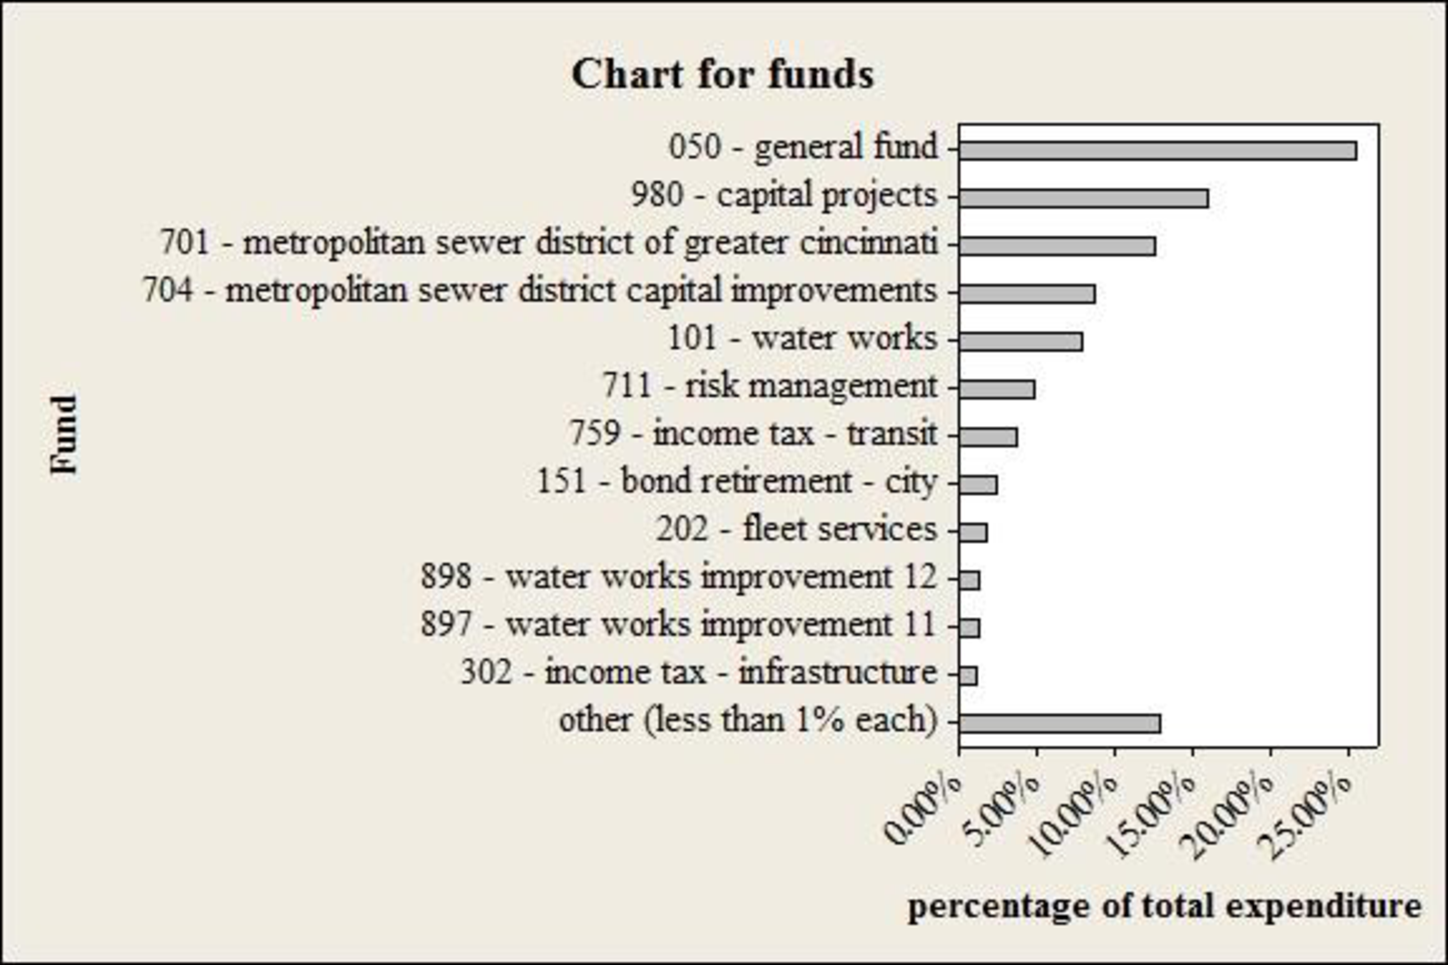
Interpretationn:
- From the obtained table and bar chart, it is observed that, the fund category 050-General fund seems to be high, in terms of total expenditure percentage.
Want to see more full solutions like this?
Chapter 2 Solutions
Statistics for Business & Economics


- The following is a list of questions answered correctly on an exam. Calculate the Measures of Central Tendency from the ungrouped data list. NUMBER OF QUESTIONS ANSWERED CORRECTLY ON AN APTITUDE EXAM 112 72 69 97 107 73 92 76 86 73 126 128 118 127 124 82 104 132 134 83 92 108 96 100 92 115 76 91 102 81 95 141 81 80 106 84 119 113 98 75 68 98 115 106 95 100 85 94 106 119arrow_forwardThe following ordered data list shows the data speeds for cell phones used by a telephone company at an airport: A. Calculate the Measures of Central Tendency using the table in point B. B. Are there differences in the measurements obtained in A and C? Why (give at least one justified reason)? 0.8 1.4 1.8 1.9 3.2 3.6 4.5 4.5 4.6 6.2 6.5 7.7 7.9 9.9 10.2 10.3 10.9 11.1 11.1 11.6 11.8 12.0 13.1 13.5 13.7 14.1 14.2 14.7 15.0 15.1 15.5 15.8 16.0 17.5 18.2 20.2 21.1 21.5 22.2 22.4 23.1 24.5 25.7 28.5 34.6 38.5 43.0 55.6 71.3 77.8arrow_forwardIn a company with 80 employees, 60 earn $10.00 per hour and 20 earn $13.00 per hour. a) Determine the average hourly wage. b) In part a), is the same answer obtained if the 60 employees have an average wage of $10.00 per hour? Prove your answer.arrow_forward
- The following ordered data list shows the data speeds for cell phones used by a telephone company at an airport: A. Calculate the Measures of Central Tendency from the ungrouped data list. B. Group the data in an appropriate frequency table. 0.8 1.4 1.8 1.9 3.2 3.6 4.5 4.5 4.6 6.2 6.5 7.7 7.9 9.9 10.2 10.3 10.9 11.1 11.1 11.6 11.8 12.0 13.1 13.5 13.7 14.1 14.2 14.7 15.0 15.1 15.5 15.8 16.0 17.5 18.2 20.2 21.1 21.5 22.2 22.4 23.1 24.5 25.7 28.5 34.6 38.5 43.0 55.6 71.3 77.8arrow_forwardBusinessarrow_forwardhttps://www.hawkeslearning.com/Statistics/dbs2/datasets.htmlarrow_forward
- NC Current Students - North Ce X | NC Canvas Login Links - North ( X Final Exam Comprehensive x Cengage Learning x WASTAT - Final Exam - STAT → C webassign.net/web/Student/Assignment-Responses/submit?dep=36055360&tags=autosave#question3659890_9 Part (b) Draw a scatter plot of the ordered pairs. N Life Expectancy Life Expectancy 80 70 600 50 40 30 20 10 Year of 1950 1970 1990 2010 Birth O Life Expectancy Part (c) 800 70 60 50 40 30 20 10 1950 1970 1990 W ALT 林 $ # 4 R J7 Year of 2010 Birth F6 4+ 80 70 60 50 40 30 20 10 Year of 1950 1970 1990 2010 Birth Life Expectancy Ox 800 70 60 50 40 30 20 10 Year of 1950 1970 1990 2010 Birth hp P.B. KA & 7 80 % 5 H A B F10 711 N M K 744 PRT SC ALT CTRLarrow_forwardHarvard University California Institute of Technology Massachusetts Institute of Technology Stanford University Princeton University University of Cambridge University of Oxford University of California, Berkeley Imperial College London Yale University University of California, Los Angeles University of Chicago Johns Hopkins University Cornell University ETH Zurich University of Michigan University of Toronto Columbia University University of Pennsylvania Carnegie Mellon University University of Hong Kong University College London University of Washington Duke University Northwestern University University of Tokyo Georgia Institute of Technology Pohang University of Science and Technology University of California, Santa Barbara University of British Columbia University of North Carolina at Chapel Hill University of California, San Diego University of Illinois at Urbana-Champaign National University of Singapore McGill…arrow_forwardName Harvard University California Institute of Technology Massachusetts Institute of Technology Stanford University Princeton University University of Cambridge University of Oxford University of California, Berkeley Imperial College London Yale University University of California, Los Angeles University of Chicago Johns Hopkins University Cornell University ETH Zurich University of Michigan University of Toronto Columbia University University of Pennsylvania Carnegie Mellon University University of Hong Kong University College London University of Washington Duke University Northwestern University University of Tokyo Georgia Institute of Technology Pohang University of Science and Technology University of California, Santa Barbara University of British Columbia University of North Carolina at Chapel Hill University of California, San Diego University of Illinois at Urbana-Champaign National University of Singapore…arrow_forward
- A company found that the daily sales revenue of its flagship product follows a normal distribution with a mean of $4500 and a standard deviation of $450. The company defines a "high-sales day" that is, any day with sales exceeding $4800. please provide a step by step on how to get the answers in excel Q: What percentage of days can the company expect to have "high-sales days" or sales greater than $4800? Q: What is the sales revenue threshold for the bottom 10% of days? (please note that 10% refers to the probability/area under bell curve towards the lower tail of bell curve) Provide answers in the yellow cellsarrow_forwardFind the critical value for a left-tailed test using the F distribution with a 0.025, degrees of freedom in the numerator=12, and degrees of freedom in the denominator = 50. A portion of the table of critical values of the F-distribution is provided. Click the icon to view the partial table of critical values of the F-distribution. What is the critical value? (Round to two decimal places as needed.)arrow_forwardA retail store manager claims that the average daily sales of the store are $1,500. You aim to test whether the actual average daily sales differ significantly from this claimed value. You can provide your answer by inserting a text box and the answer must include: Null hypothesis, Alternative hypothesis, Show answer (output table/summary table), and Conclusion based on the P value. Showing the calculation is a must. If calculation is missing,so please provide a step by step on the answers Numerical answers in the yellow cellsarrow_forward

 Elementary Geometry for College StudentsGeometryISBN:9781285195698Author:Daniel C. Alexander, Geralyn M. KoeberleinPublisher:Cengage Learning