
Concept explainers
(a)
Interpretation:
The potential of the electrode with respect to a Ag/AgCl(sat’d) reference electrode after addition of different volumes of Cerium(IV) should be calculated.
Concept introduction:
Nernst equation gives the cell potential under non-standard conditions.
E − cell potential
E0 − standard cell potential
R − universal gas constant
T − temperature in Kelvin
n − number of electrons transferred
F − Faraday constant
Q − Reaction quotient
Answer to Problem 23.24QAP
| Volume of Ce4+, mL | Ecell, V |
| 5.00 | 0.712754 |
| 10.00 | 0.723179 |
| 15.00 | 0.730108 |
| 20.00 | 0.735787 |
| 24.00 | 0.739971 |
| 24.90 | 0.740897 |
| 25.00 | 0.741 |
| 40.00 | 0.75882 |
| 45.00 | 0.769244 |
| 49.00 | 0.791022 |
| 49.50 | 0.800055 |
| 49.60 | 0.802945 |
| 49.70 | 0.806663 |
| 49.80 | 0.811887 |
| 49.90 | 0.820784 |
| 49.95 | 0.829627 |
| 49.99 | 0.849708 |
| 50.00 | 0.907667 |
| 50.01 | 1.020361 |
| 50.05 | 1.063076 |
| 50.10 | 1.081059 |
| 50.20 | 1.098961 |
| 50.30 | 1.109413 |
| 50.40 | 1.116822 |
| 50.50 | 1.122568 |
| 51.00 | 1.140405 |
| 55.00 | 1.181796 |
| 60.00 | 1.199619 |
| 75.00 | 1.223178 |
| 90.00 | 1.235262 |
Explanation of Solution
The electrode potentials for half cell reactions are as follows:
The overall reaction will be:
Overall reaction:
The system is at equilibrium all time. So, the electrode potential for the two half-cell reactions are always equal
(1) + (2) x 2
Since, the hydrogen ion concentration is at 1.00 M throughout the titration,one can simplify the above equation.
At equivalence point,
So,
Potential before the equivalence point can be determined by applying the Nernst equation for HNO2/NO3- half-cell reaction. And potential after the equivalence point can be determined by applying Nernst equation for the Ce4+/Ce3+ half-cell reaction.
Initial concentration of HNO2 =
Volume of Ce4+ spent at the equivalence point =
When 5.00 mL of Ce4+ solution is added,
Concentration of NO3- =
=
Concentration of HNO2 left =
=
When 50.01 mL of Ce4+ added
Concentration of Ce4+ =
=
Concentration of Ce3+ =
=
likewise, one can calculate the concentrations of the species when other volumes of Ce4+ added. And then the electrode potential can be calculated. The potential of the indicator electrode with respect to a Ag/AgCl reference electrode can be calculated by subtracting the Ag/AgCl standard electrode potential from the electrode potential for the redox reaction calculated.
| Volume of Ce4+, mL | [NO3-] | [HNO2] | [Ce3+] | [Ce4+] | Ecell, V |
| 5.00 | 0.0025 | 0.0225 | 0.712754 | ||
| 10.00 | 0.004705882 | 0.018824 | 0.723179 | ||
| 15.00 | 0.006666667 | 0.015556 | 0.730108 | ||
| 20.00 | 0.008421053 | 0.012632 | 0.735787 | ||
| 24.00 | 0.00969697 | 0.010505 | 0.739971 | ||
| 24.90 | 0.00996997 | 0.01005 | 0.740897 | ||
| 25.00 | 0.01 | 0.01 | 0.741 | ||
| 40.00 | 0.013913043 | 0.003478 | 0.75882 | ||
| 45.00 | 0.015 | 0.001667 | 0.769244 | ||
| 49.00 | 0.015806452 | 0.000323 | 0.791022 | ||
| 49.50 | 0.015903614 | 0.000161 | 0.800055 | ||
| 49.60 | 0.015922953 | 0.000129 | 0.802945 | ||
| 49.70 | 0.015942261 | 9.64E-05 | 0.806663 | ||
| 49.80 | 0.015961538 | 6.43E-05 | 0.811887 | ||
| 49.90 | 0.015980785 | 3.22E-05 | 0.820784 | ||
| 49.95 | 0.015990396 | 1.62E-05 | 0.829627 | ||
| 49.99 | 0.01599808 | 3.4E-06 | 0.849708 | ||
| 50.00 | 0.907667 | ||||
| 50.01 | 0.031998 | 5.99952E-06 | 1.020361 | ||
| 50.05 | 0.031988 | 3.15874E-05 | 1.063076 | ||
| 50.10 | 0.031975 | 6.35492E-05 | 1.081059 | ||
| 50.20 | 0.031949 | 0.000127396 | 1.098961 | ||
| 50.30 | 0.031924 | 0.000191141 | 1.109413 | ||
| 50.40 | 0.031898 | 0.000254785 | 1.116822 | ||
| 50.50 | 0.031873 | 0.000318327 | 1.122568 | ||
| 51.00 | 0.031746 | 0.000634524 | 1.140405 | ||
| 55.00 | 0.03077 | 0.003076538 | 1.181796 | ||
| 60.00 | 0.02963 | 0.005925556 | 1.199619 | ||
| 75.00 | 0.026667 | 0.013333 | 1.223178 | ||
| 90.00 | 0.024243 | 0.019393636 | 1.235262 |
(b)
Interpretation:
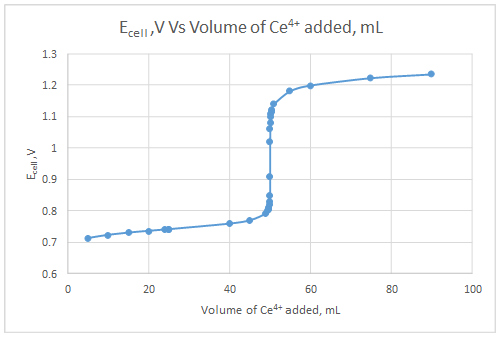
A titration curve should be constructed
Concept introduction:
Potentiometric titration is similar to direct redox titrations but in potentiometric titrations no indicator is used. Instead, the potential is measured during the titration to obtain the equivalence point.
Answer to Problem 23.24QAP
Explanation of Solution
The dependent variable is the indicator electrode potential and the independent variable is volume of Ce4+ solution added.

(c)
Interpretation:
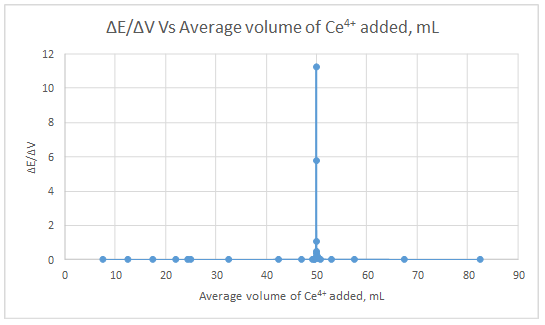
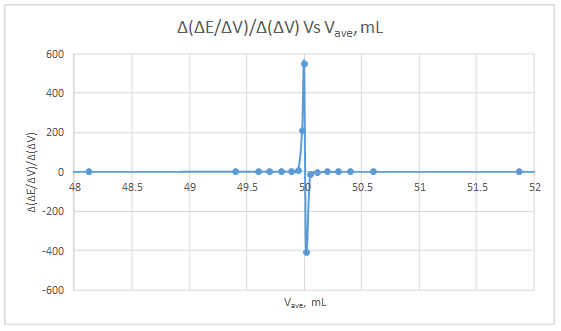
A first and second derivative curve for the data should be generated.
Concept introduction:
The first derivative curve of the potentiometric titration is plotted between
Answer to Problem 23.24QAP
First derivative curve:
Second derivative curve:
Explanation of Solution
| ΔE | ΔV | ΔE/ΔV | Vave | Δ(ΔE/ΔV) | Δ(ΔV) | Δ(ΔE/ΔV)/Δ(ΔV) | Vave |
| 0.010425 | 5 | 0.002085 | 7.5 | ||||
| 0.006929 | 5 | 0.001386 | 12.5 | -0.0006992 | 5 | -0.00013984 | 10 |
| 0.005679 | 5 | 0.001136 | 17.5 | -0.00025 | 5 | -5E-05 | 15 |
| 0.004184 | 4 | 0.001046 | 22 | -8.98E-05 | 4.5 | -1.99556E-05 | 19.75 |
| 0.000926 | 0.9 | 0.001029 | 24.45 | -1.71111E-05 | 2.45 | -6.98413E-06 | 23.225 |
| 0.000103 | 0.1 | 0.00103 | 24.95 | 1.11111E-06 | 0.5 | 2.22222E-06 | 24.7 |
| 0.01782 | 15 | 0.001188 | 32.5 | 0.000158 | 7.55 | 2.09272E-05 | 28.725 |
| 0.010424 | 5 | 0.002085 | 42.5 | 0.0008968 | 10 | 8.968E-05 | 37.5 |
| 0.021778 | 4 | 0.005444 | 47 | 0.0033597 | 4.5 | 0.0007466 | 44.75 |
| 0.009033 | 0.5 | 0.018066 | 49.25 | 0.0126215 | 2.25 | 0.005609556 | 48.125 |
| 0.00289 | 0.1 | 0.0289 | 49.55 | 0.010834 | 0.3 | 0.036113333 | 49.4 |
| 0.003718 | 0.1 | 0.03718 | 49.65 | 0.00828 | 0.1 | 0.0828 | 49.6 |
| 0.005224 | 0.1 | 0.05224 | 49.75 | 0.01506 | 0.1 | 0.1506 | 49.7 |
| 0.008897 | 0.1 | 0.08897 | 49.85 | 0.03673 | 0.1 | 0.3673 | 49.8 |
| 0.008843 | 0.05 | 0.17686 | 49.925 | 0.08789 | 0.075 | 1.171866667 | 49.8875 |
| 0.020081 | 0.04 | 0.502025 | 49.97 | 0.325165 | 0.045 | 7.225888889 | 49.9475 |
| 0.057959 | 0.01 | 5.7959 | 49.995 | 5.293875 | 0.025 | 211.755 | 49.9825 |
| 0.112694 | 0.01 | 11.2694 | 50.005 | 5.4735 | 0.01 | 547.35 | 50 |
| 0.042715 | 0.04 | 1.067875 | 50.03 | -10.201525 | 0.025 | -408.061 | 50.0175 |
| 0.017983 | 0.05 | 0.35966 | 50.075 | -0.708215 | 0.045 | -15.73811111 | 50.0525 |
| 0.017902 | 0.1 | 0.17902 | 50.15 | -0.18064 | 0.075 | -2.408533333 | 50.1125 |
| 0.010452 | 0.1 | 0.10452 | 50.25 | -0.0745 | 0.1 | -0.745 | 50.2 |
| 0.007409 | 0.1 | 0.07409 | 50.35 | -0.03043 | 0.1 | -0.3043 | 50.3 |
| 0.005746 | 0.1 | 0.05746 | 50.45 | -0.01663 | 0.1 | -0.1663 | 50.4 |
| 0.017837 | 0.5 | 0.035674 | 50.75 | -0.021786 | 0.3 | -0.07262 | 50.6 |
| 0.041391 | 4 | 0.010348 | 53 | -0.02532625 | 2.25 | -0.011256111 | 51.875 |
| 0.017823 | 5 | 0.003565 | 57.5 | -0.00678315 | 4.5 | -0.001507367 | 55.25 |
| 0.023559 | 15 | 0.001571 | 67.5 | -0.001994 | 10 | -0.0001994 | 62.5 |
| 0.012084 | 15 | 0.000806 | 82.5 | -0.000765 | 15 | -5.1E-05 | 75 |
First derivative curve:

Second derivative curve:

The volume at which the second-derivative curve cross zero correspond to the theoretical equivalence point. Theoretical equivalence point is 50.00 mL.At the maximum of the peak in the first derivative curve has a slope of zero. So, in the second derivative curve crosses the x axis at the point, corresponding to the equivalence point.
Want to see more full solutions like this?
Chapter 23 Solutions
PRINCIPLES OF INSTRUMENTAL ANALYSIS


- What is the reaction mechanism for this?arrow_forwardPredict the major products of both organic reactions. Be sure to use wedge and dash bonds to show the stereochemistry of the products when it's important, for example to distinguish between two different major products. esc esc Explanation Check 2 : + + X H₁₂O + Х ง WW E R Y qab Ccaps lock shift $ P X Click and drag to start drawing a structure. © 2025 McGraw Hill LLC. All Rights Reserved. Terms of Use | Privacy Center | Accessibility Bil T FR F18 9 G t K L Z X V B N M control opption command command T C darrow_forwardDraw the Markovnikov product of the hydrohalogenation of this alkene. this problem. Note for advanced students: draw only one product, and don't worry about showing any stereochemistry. Drawing dash and wedge bonds has been disabled for caps lock Explanation Check 2 W E R + X 5 HCI Click and drag to start drawing a structure. © 2025 McGraw Hill LLC. All Rights Reserved. Terms of Use | Privacy Center | Accessibility Bil Y F G H K L ZZ X C V B N M control opption command F10 F10 command 4 BA Ar Carrow_forward
- I don't understand why the amide on the top left, with the R attached to one side, doesn't get substituted with OH to form a carboxylic acid. And if only one can be substituted, why did it choose the amide it chose rather than the other amide?arrow_forwardesc Draw the Markovnikov product of the hydration of this alkene. Note for advanced students: draw only one product, and don't worry about showing any stereochemistry. Drawing dash and wedge bonds has been disabled for this problem. Explanation Check BBB + X 0 1. Hg (OAc)2, H₂O 2. Na BH 5 Click and drag to start drawing a structure. © 2025 McGraw Hill LLC. All Rights Reserved. Terms of Use | Privacy Center | Accessibility Bl P 豆 28 2 28 N 9 W E R T Y A S aps lock G H K L Z X C V B N M T central H command #e commandarrow_forwardC A student proposes the transformation below in one step of an organic synthesis. There may be one or more products missing from the right-hand side, but there are no reagents missing from the left-hand side. There may also be catalysts, small inorganic reagents, and other important reaction conditions missing from the arrow. • Is the student's transformation possible? If not, check the box under the drawing area. . If the student's transformation is possible, then complete the reaction by adding any missing products to the right-hand side, and adding required catalysts, inorganic reagents, or other important reaction conditions above and below the arrow. • You do not need to balance the reaction, but be sure every important organic reactant or product is shown. (X) This transformation can't be done in one step. + Tarrow_forward
- く Predict the major products of this organic reaction. If there aren't any products, because nothing will happen, check the box under the drawing area instead. No reaction. Explanation Check OH + + ✓ 2 H₂SO 4 O xs H₂O 2 Click and drag to start drawing a structure. © 2025 McGraw Hill LLC. All Rights Reserved. Terms of Use | Privacy Centerarrow_forwardDraw the skeletal ("line") structure of 1,3-dihydroxy-2-pentanone. Click and drag to start drawing a structure. X Parrow_forwardPredicting edict the major products of this organic reaction. If there aren't any products, because nothing will happen, check the box under the drawing area instead. + No reaction. Explanation Check HO Na O H xs H₂O 2 Click and drag to start drawing a structure. © 2025 McGraw Hill LLC. All Rights Reserved. Terms of Use | Privacy Center Iarrow_forward
- Choosing reagents and conditions for acetal formation or hydrolysis 0/5 A student proposes the transformation below in one step of an organic synthesis. There may be one or more products missing from the right-hand side, but there are no reagents missing from the left-hand side. There may also be catalysts, small inorganic reagents, and other important reaction conditions missing from the arrow. • Is the student's transformation possible? If not, check the box under the drawing area. If the student's transformation is possible, then complete the reaction by adding any missing products to the right-hand side, and adding required catalysts, inorganic reagents, or other important reaction conditions above and below the arrow. • You do not need to balance the reaction, but be sure every important organic reactant or product is shown. + This transformation can't be done in one step. 5 I H Autumn alo 值 Ar Barrow_forwardA block of copper of mass 2.00kg(cp = 0.3851 .K) and g temperature 0°C is introduced into an insulated container in which there is 1.00molH, O(g) at 100°C and 1.00 2 atm. Note that C P = 4.184. K for liquid water, and g that A H = 2260 for water. vap g Assuming all the steam is condensed to water, and that the pressure remains constant: (a) What will be the final temperature of the system? (b) What is the heat transferred from the water to the copper? (c) What is the entropy change of the water, the copper, and the total system?arrow_forwardIdentify the missing organic reactants in the following reaction: H+ X + Y OH H+ O O Note: This chemical equation only focuses on the important organic molecules in the reaction. Additional inorganic or small-molecule reactants or products (like H₂O) are not shown. In the drawing area below, draw the skeletal ("line") structures of the missing organic reactants X and Y. You may draw the structures in any arrangement that you like, so long as they aren't touching. Explanation Check Click and drag to start drawing a structure. X G 2025 McGraw Hill LLC. All Rights Reserved. Terms of Use | Privacy Cente ? Earrow_forward

 Chemistry: The Molecular ScienceChemistryISBN:9781285199047Author:John W. Moore, Conrad L. StanitskiPublisher:Cengage Learning
 Principles of Instrumental AnalysisChemistryISBN:9781305577213Author:Douglas A. Skoog, F. James Holler, Stanley R. CrouchPublisher:Cengage Learning
 ChemistryChemistryISBN:9781305957404Author:Steven S. Zumdahl, Susan A. Zumdahl, Donald J. DeCostePublisher:Cengage Learning
 Chemistry: An Atoms First ApproachChemistryISBN:9781305079243Author:Steven S. Zumdahl, Susan A. ZumdahlPublisher:Cengage Learning