
Concept explainers
(a)
Interpretation:
The potential of the electrode with respect to a Ag/AgCl(sat’d) reference electrode after addition of different volumes of Cerium(IV) should be calculated.
Concept introduction:
Nernst equation gives the cell potential under non-standard conditions.
E − cell potential
E0 − standard cell potential
R − universal gas constant
T − temperature in Kelvin
n − number of electrons transferred
F − Faraday constant
Q − Reaction quotient
Answer to Problem 23.24QAP
| Volume of Ce4+, mL | Ecell, V |
| 5.00 | 0.712754 |
| 10.00 | 0.723179 |
| 15.00 | 0.730108 |
| 20.00 | 0.735787 |
| 24.00 | 0.739971 |
| 24.90 | 0.740897 |
| 25.00 | 0.741 |
| 40.00 | 0.75882 |
| 45.00 | 0.769244 |
| 49.00 | 0.791022 |
| 49.50 | 0.800055 |
| 49.60 | 0.802945 |
| 49.70 | 0.806663 |
| 49.80 | 0.811887 |
| 49.90 | 0.820784 |
| 49.95 | 0.829627 |
| 49.99 | 0.849708 |
| 50.00 | 0.907667 |
| 50.01 | 1.020361 |
| 50.05 | 1.063076 |
| 50.10 | 1.081059 |
| 50.20 | 1.098961 |
| 50.30 | 1.109413 |
| 50.40 | 1.116822 |
| 50.50 | 1.122568 |
| 51.00 | 1.140405 |
| 55.00 | 1.181796 |
| 60.00 | 1.199619 |
| 75.00 | 1.223178 |
| 90.00 | 1.235262 |
Explanation of Solution
The electrode potentials for half cell reactions are as follows:
The overall reaction will be:
Overall reaction:
The system is at equilibrium all time. So, the electrode potential for the two half-cell reactions are always equal
(1) + (2) x 2
Since, the hydrogen ion concentration is at 1.00 M throughout the titration,one can simplify the above equation.
At equivalence point,
So,
Potential before the equivalence point can be determined by applying the Nernst equation for HNO2/NO3- half-cell reaction. And potential after the equivalence point can be determined by applying Nernst equation for the Ce4+/Ce3+ half-cell reaction.
Initial concentration of HNO2 =
Volume of Ce4+ spent at the equivalence point =
When 5.00 mL of Ce4+ solution is added,
Concentration of NO3- =
=
Concentration of HNO2 left =
=
When 50.01 mL of Ce4+ added
Concentration of Ce4+ =
=
Concentration of Ce3+ =
=
likewise, one can calculate the concentrations of the species when other volumes of Ce4+ added. And then the electrode potential can be calculated. The potential of the indicator electrode with respect to a Ag/AgCl reference electrode can be calculated by subtracting the Ag/AgCl standard electrode potential from the electrode potential for the redox reaction calculated.
| Volume of Ce4+, mL | [NO3-] | [HNO2] | [Ce3+] | [Ce4+] | Ecell, V |
| 5.00 | 0.0025 | 0.0225 | 0.712754 | ||
| 10.00 | 0.004705882 | 0.018824 | 0.723179 | ||
| 15.00 | 0.006666667 | 0.015556 | 0.730108 | ||
| 20.00 | 0.008421053 | 0.012632 | 0.735787 | ||
| 24.00 | 0.00969697 | 0.010505 | 0.739971 | ||
| 24.90 | 0.00996997 | 0.01005 | 0.740897 | ||
| 25.00 | 0.01 | 0.01 | 0.741 | ||
| 40.00 | 0.013913043 | 0.003478 | 0.75882 | ||
| 45.00 | 0.015 | 0.001667 | 0.769244 | ||
| 49.00 | 0.015806452 | 0.000323 | 0.791022 | ||
| 49.50 | 0.015903614 | 0.000161 | 0.800055 | ||
| 49.60 | 0.015922953 | 0.000129 | 0.802945 | ||
| 49.70 | 0.015942261 | 9.64E-05 | 0.806663 | ||
| 49.80 | 0.015961538 | 6.43E-05 | 0.811887 | ||
| 49.90 | 0.015980785 | 3.22E-05 | 0.820784 | ||
| 49.95 | 0.015990396 | 1.62E-05 | 0.829627 | ||
| 49.99 | 0.01599808 | 3.4E-06 | 0.849708 | ||
| 50.00 | 0.907667 | ||||
| 50.01 | 0.031998 | 5.99952E-06 | 1.020361 | ||
| 50.05 | 0.031988 | 3.15874E-05 | 1.063076 | ||
| 50.10 | 0.031975 | 6.35492E-05 | 1.081059 | ||
| 50.20 | 0.031949 | 0.000127396 | 1.098961 | ||
| 50.30 | 0.031924 | 0.000191141 | 1.109413 | ||
| 50.40 | 0.031898 | 0.000254785 | 1.116822 | ||
| 50.50 | 0.031873 | 0.000318327 | 1.122568 | ||
| 51.00 | 0.031746 | 0.000634524 | 1.140405 | ||
| 55.00 | 0.03077 | 0.003076538 | 1.181796 | ||
| 60.00 | 0.02963 | 0.005925556 | 1.199619 | ||
| 75.00 | 0.026667 | 0.013333 | 1.223178 | ||
| 90.00 | 0.024243 | 0.019393636 | 1.235262 |
(b)
Interpretation:
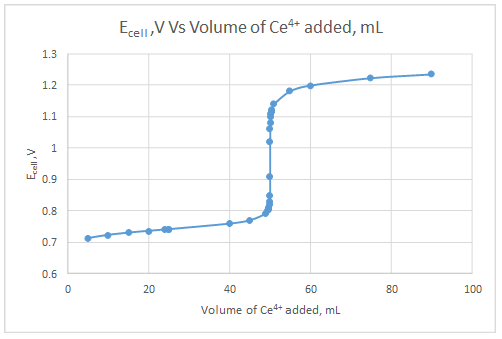
A titration curve should be constructed
Concept introduction:
Potentiometric titration is similar to direct redox titrations but in potentiometric titrations no indicator is used. Instead, the potential is measured during the titration to obtain the equivalence point.
Answer to Problem 23.24QAP
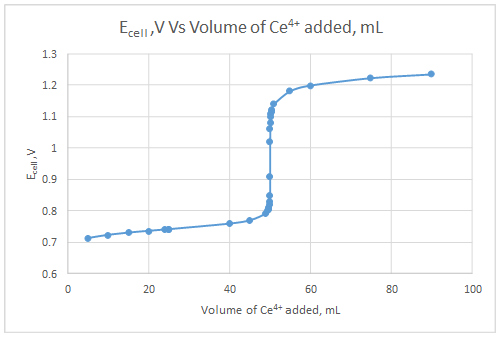
Explanation of Solution
The dependent variable is the indicator electrode potential and the independent variable is volume of Ce4+ solution added.
(c)
Interpretation:
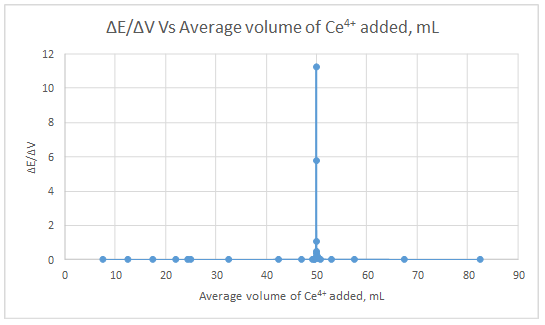
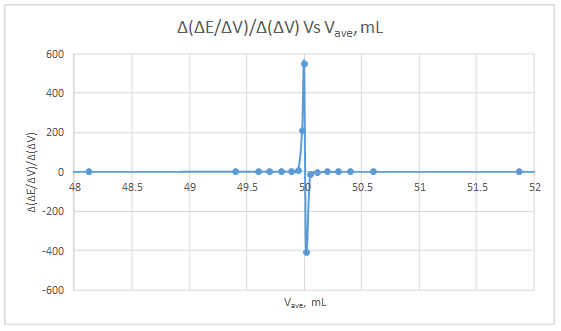
A first and second derivative curve for the data should be generated.
Concept introduction:
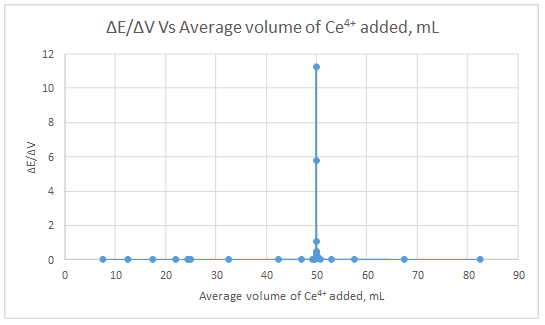
The first derivative curve of the potentiometric titration is plotted between
Answer to Problem 23.24QAP
First derivative curve:
Second derivative curve:
Explanation of Solution
| ΔE | ΔV | ΔE/ΔV | Vave | Δ(ΔE/ΔV) | Δ(ΔV) | Δ(ΔE/ΔV)/Δ(ΔV) | Vave |
| 0.010425 | 5 | 0.002085 | 7.5 | ||||
| 0.006929 | 5 | 0.001386 | 12.5 | -0.0006992 | 5 | -0.00013984 | 10 |
| 0.005679 | 5 | 0.001136 | 17.5 | -0.00025 | 5 | -5E-05 | 15 |
| 0.004184 | 4 | 0.001046 | 22 | -8.98E-05 | 4.5 | -1.99556E-05 | 19.75 |
| 0.000926 | 0.9 | 0.001029 | 24.45 | -1.71111E-05 | 2.45 | -6.98413E-06 | 23.225 |
| 0.000103 | 0.1 | 0.00103 | 24.95 | 1.11111E-06 | 0.5 | 2.22222E-06 | 24.7 |
| 0.01782 | 15 | 0.001188 | 32.5 | 0.000158 | 7.55 | 2.09272E-05 | 28.725 |
| 0.010424 | 5 | 0.002085 | 42.5 | 0.0008968 | 10 | 8.968E-05 | 37.5 |
| 0.021778 | 4 | 0.005444 | 47 | 0.0033597 | 4.5 | 0.0007466 | 44.75 |
| 0.009033 | 0.5 | 0.018066 | 49.25 | 0.0126215 | 2.25 | 0.005609556 | 48.125 |
| 0.00289 | 0.1 | 0.0289 | 49.55 | 0.010834 | 0.3 | 0.036113333 | 49.4 |
| 0.003718 | 0.1 | 0.03718 | 49.65 | 0.00828 | 0.1 | 0.0828 | 49.6 |
| 0.005224 | 0.1 | 0.05224 | 49.75 | 0.01506 | 0.1 | 0.1506 | 49.7 |
| 0.008897 | 0.1 | 0.08897 | 49.85 | 0.03673 | 0.1 | 0.3673 | 49.8 |
| 0.008843 | 0.05 | 0.17686 | 49.925 | 0.08789 | 0.075 | 1.171866667 | 49.8875 |
| 0.020081 | 0.04 | 0.502025 | 49.97 | 0.325165 | 0.045 | 7.225888889 | 49.9475 |
| 0.057959 | 0.01 | 5.7959 | 49.995 | 5.293875 | 0.025 | 211.755 | 49.9825 |
| 0.112694 | 0.01 | 11.2694 | 50.005 | 5.4735 | 0.01 | 547.35 | 50 |
| 0.042715 | 0.04 | 1.067875 | 50.03 | -10.201525 | 0.025 | -408.061 | 50.0175 |
| 0.017983 | 0.05 | 0.35966 | 50.075 | -0.708215 | 0.045 | -15.73811111 | 50.0525 |
| 0.017902 | 0.1 | 0.17902 | 50.15 | -0.18064 | 0.075 | -2.408533333 | 50.1125 |
| 0.010452 | 0.1 | 0.10452 | 50.25 | -0.0745 | 0.1 | -0.745 | 50.2 |
| 0.007409 | 0.1 | 0.07409 | 50.35 | -0.03043 | 0.1 | -0.3043 | 50.3 |
| 0.005746 | 0.1 | 0.05746 | 50.45 | -0.01663 | 0.1 | -0.1663 | 50.4 |
| 0.017837 | 0.5 | 0.035674 | 50.75 | -0.021786 | 0.3 | -0.07262 | 50.6 |
| 0.041391 | 4 | 0.010348 | 53 | -0.02532625 | 2.25 | -0.011256111 | 51.875 |
| 0.017823 | 5 | 0.003565 | 57.5 | -0.00678315 | 4.5 | -0.001507367 | 55.25 |
| 0.023559 | 15 | 0.001571 | 67.5 | -0.001994 | 10 | -0.0001994 | 62.5 |
| 0.012084 | 15 | 0.000806 | 82.5 | -0.000765 | 15 | -5.1E-05 | 75 |
First derivative curve:
Second derivative curve:
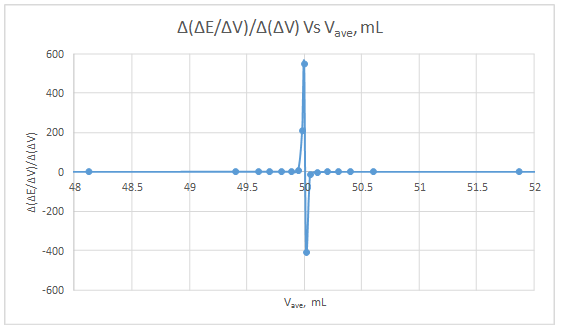
The volume at which the second-derivative curve cross zero correspond to the theoretical equivalence point. Theoretical equivalence point is 50.00 mL.At the maximum of the peak in the first derivative curve has a slope of zero. So, in the second derivative curve crosses the x axis at the point, corresponding to the equivalence point.
Want to see more full solutions like this?
Chapter 23 Solutions
Principles of Instrumental Analysis, 6th Edition
- Label all absorptions over 1500 cm-1. Please be specific and mark IR if needed for explanation. Compound OH sp^3 C-H C=O C-O Triglyceridearrow_forwardIdentify the intermediate that is INITIALLY formed in a saponification reaction (hydrolysis of an ester). III -OH H₂O HO OH HO O || A B C III D IV IVarrow_forwardHelp me answer this practice sheet I found for an answer guidearrow_forward
- show the retrosynthesis of this molecule step by step starting with 1,3-dimethoxy benzene H3CO OH OH OCH 3arrow_forwardConsider the reaction of a propanoate ester with hydroxide ion shown below. A series of four alcohol leaving groups were tested to determine which would be the best leaving group. Based on the pKa values of the alcohols, predict which alcohol would produce the fastest hydrolysis reaction. HO FOR A Alcohol I, pKa =16.0 B Alcohol II, pKa =10.0 C Alcohol III, pKa = 7.2 + ROH D Alcohol IV, pKa = 6.6arrow_forwardCurved arrows are used to illustrate the flow of electrons. Using the provided starting and product structures, draw the curved electron-pushing arrows for the following reaction or mechanistic step(s). Be sure to account for all bond-breaking and bond-making steps. :0: NaOH, H₂O 00:4 Na O heat NaO Select to Add Arrows Select to Add Arrows :0: Na a NaOH, H2O :0: NaOH, H2O heat heat Na ONH Select to Add Arrowsarrow_forward
- Curved arrows are used to illustrate the flow of electrons. Using the provided starting and product structures, draw the curved electron-pushing arrows for the following reaction or mechanistic step(s). Be sure to account for all bond-breaking and bond-making steps. H CH3NH3+ :0: :0: HO CH3NH2 HH iSelect to Add Arrows i Select to Add Arrows i HH CH3NH3+ CH3NH2 Select to Add Arrows i CH3NH3 CH3NH2 ايكدا HH Select to Add Arrowsarrow_forwardThe reaction is carried out with gases: A → B + C at 300 K. The total pressure is measured as a function of time (table). If the reaction order is 2, calculate the rate or kinetic constant k (in mol-1 L s¹) Ptotal (atm) 492 676 760 808 861 t(s) 0 600 1200 1800 3000arrow_forwardcan someone give a description of this NMR including whether its a triplt singlet doublet where the peak is around at ppm and what functional group it representsarrow_forward
- 1. Determine the relationship between the following molecules as identical, diastereomers, or enantiomers (6 points, 2 points each). OH OH OH A-A OH HOT HO- ACHN and HO- ACHN OH HO HO ° OH and OH OH SH and ...SHarrow_forward20,0 Complete the electron pushing mechanism to y drawing the necomery unicaciones and carved on for Step 1: Add curved arms for the tint step, traiment with NalilĻ. The Nation 458 Step 2: Added for the second step, inalment with), how the "counterion bar Step 3: Daw the products of the last simplom organic and one incoganic spacient, including all nonbondingarrow_forwardplease provide the structure for this problem, thank you!arrow_forward
 Chemistry: The Molecular ScienceChemistryISBN:9781285199047Author:John W. Moore, Conrad L. StanitskiPublisher:Cengage Learning
 Principles of Instrumental AnalysisChemistryISBN:9781305577213Author:Douglas A. Skoog, F. James Holler, Stanley R. CrouchPublisher:Cengage Learning
 ChemistryChemistryISBN:9781305957404Author:Steven S. Zumdahl, Susan A. Zumdahl, Donald J. DeCostePublisher:Cengage Learning
 Chemistry: An Atoms First ApproachChemistryISBN:9781305079243Author:Steven S. Zumdahl, Susan A. ZumdahlPublisher:Cengage Learning


