Concept explainers
Videos
To review:
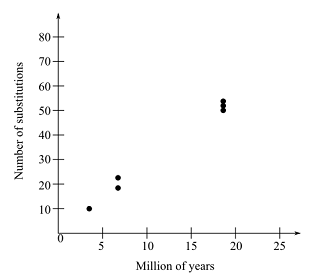
The relationship between the number of synonymous substitutions and the years of divergence between each pair of species, with the help of a graph. Also, estimate the rates of synonymous substitutions per million years and per generation for the complete axon on a per-site basis.
Given:
In the given study, a hypothetical gene encodes for the transcription factor in various species of Drosophila. According to the diagram (Figure 1) given below, one exon of this gene is sequenced in four species.
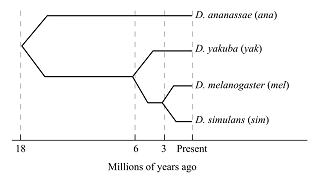
Figure 1: Million of years ago.
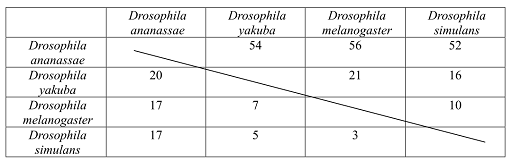
The matrix shows the number of synonymous and nonsynonymous substitutions between pairs of different Drosophila species, which evolved as a result of evolution. There are 2,000 nonsynonymous and 600 synonymous substitutions sites of the exon (Figure 2).
Figure 2: Matrix showing the number of synonymous and nonsynonymous substitutions between pairs of species of Drosophila.
Introduction:
Biologists are able to make inference about the type of natural selection, by the study based on molecular evolutionary patterns of genes. These inferences are important to know, about the gene functioning and how they evolve over the time, in response to the new function and conditions.
Explanation of Solution
According to the given analysis, there are, on an average, 54 synonymous substitutions occurs between the lineages. These lineages were diverged 18 million years ago. So, there are about 1.5 synonymous substitutions per million year for the entire exon.
Therefore, the information used for calculation of the rate is:
Time period: 18 million years ago
Substitution per million years: 1.5
Lineages: 2
Generation per year: 5
Synonymous sites: 600
Thus, for rate of substitution per generation is:
90,000,000 years
Similarly, the rate of substitution per site is:
(90,000,000 years
Graph given below shows number of substitution along with millions of years.
Therefore, it can be concluded that the rates are 3
Want to see more full solutions like this?
Chapter 23 Solutions
LIFE:SCIENCE OF BIOL.(LL) >CUSTOM<


- Linkage in common bean Alleles at the P locus control seed color. Plants which are pp have white seeds, white flowers and no pigment in vegetative parts. Plants which are P_ have black seeds, purple flowers and may have varying degrees of pigment on stems and leaves. Seed color can be assessed, visually, based on if the seed is white or not white A gene for mold resistance has been reported and we want to determine its inheritance and whether it is linked to P. For the purposes of this exercise, we will assume that resistance is controlled by a single locus M, and M_ plants are resistant and mm plants are susceptible. Resistance can be measured, under greenhouse conditions, 2 weeks after planting, by injecting each seedling with a spore suspension. After two weeks, the seedlings can be rated as resistant or susceptible, based on whether or not tissue is actively sporulating. For this exercise we will use seed and data from the F10 generation of a recombinant inbred population…arrow_forwardAlleles at the P locus control seed color. Plants which are pp have white seeds, white flowers and no pigment in vegetative parts. Plants which are P_ have black seeds, purple flowers and may have varying degrees of pigment on stems and leaves. Seed color can be assessed, visually, based on if the seed is white or not white A gene for mold resistance has been reported and we want to determine its inheritance and whether it is linked to P. For the purposes of this exercise, we will assume that resistance is controlled by a single locus M, and M_ plants are resistant and mm plants are susceptible. Resistance can be measured, under greenhouse conditions, 2 weeks after planting, by injecting each seedling with a spore suspension. After two weeks, the seedlings can be rated as resistant or susceptible, based on whether or not tissue is actively sporulating. For this exercise we will use seed and data from the F10 generation of a recombinant inbred population produced using single seed…arrow_forwardcan you help? I think its B but not surearrow_forward
- Skip to main content close Homework Help is Here – Start Your Trial Now! arrow_forward search SEARCH ASK Human Anatomy & Physiology (11th Edition)BUY Human Anatomy & Physiology (11th Edition) 11th Edition ISBN: 9780134580999 Author: Elaine N. Marieb, Katja N. Hoehn Publisher: PEARSON 1 The Human Body: An Orientation expand_moreChapter 1 : The Human Body: An Orientation Chapter Questions expand_moreSection: Chapter Questions Problem 1RQ: The correct sequence of levels forming the structural hierarchy is A. (a) organ, organ system,... format_list_bulletedProblem 1RQ: The correct sequence of levels forming the structural hierarchy is A. (a) organ, organ system,... See similar textbooks Bartleby Related Questions Icon Related questions Bartleby Expand Icon bartleby Concept explainers bartleby Question Draw a replication bubble with two replication forks.blue lines are DNA single strands and red lines are RNA single strands.indicate all 3' and 5’ ends on all DNA single…arrow_forwardProvide an answerarrow_forwardQuestion 4 1 pts Which of the following would be most helpful for demonstrating alternative splicing for a new organism? ○ its proteome and its transcriptome only its transcriptome only its genome its proteome and its genomearrow_forward
- What did the Cre-lox system used in the Kikuchi et al. 2010 heart regeneration experiment allow researchers to investigate? What was the purpose of the cmlc2 promoter? What is CreER and why was it used in this experiment? If constitutively active Cre was driven by the cmlc2 promoter, rather than an inducible CreER system, what color would you expect new cardiomyocytes in the regenerated area to be no matter what? Why?arrow_forwardWhat kind of organ size regulation is occurring when you graft multiple organs into a mouse and the graft weight stays the same?arrow_forwardWhat is the concept "calories consumed must equal calories burned" in regrads to nutrition?arrow_forward
 Biology: The Dynamic Science (MindTap Course List)BiologyISBN:9781305389892Author:Peter J. Russell, Paul E. Hertz, Beverly McMillanPublisher:Cengage Learning
 Human Biology (MindTap Course List)BiologyISBN:9781305112100Author:Cecie Starr, Beverly McMillanPublisher:Cengage Learning
 Human Heredity: Principles and Issues (MindTap Co...BiologyISBN:9781305251052Author:Michael CummingsPublisher:Cengage Learning
 Biology (MindTap Course List)BiologyISBN:9781337392938Author:Eldra Solomon, Charles Martin, Diana W. Martin, Linda R. BergPublisher:Cengage Learning
 Biology: The Unity and Diversity of Life (MindTap...BiologyISBN:9781337408332Author:Cecie Starr, Ralph Taggart, Christine Evers, Lisa StarrPublisher:Cengage Learning
 Biology 2eBiologyISBN:9781947172517Author:Matthew Douglas, Jung Choi, Mary Ann ClarkPublisher:OpenStax