Biology
4th Edition
ISBN: 9781259188121
Author: Peter Stiling, Robert Brooker, Linda Graham, Eric Widmaier
Publisher: McGraw-Hill Education
expand_more
expand_more
format_list_bulleted
Concept explainers
Textbook Question
Chapter 2.3, Problem 1BC
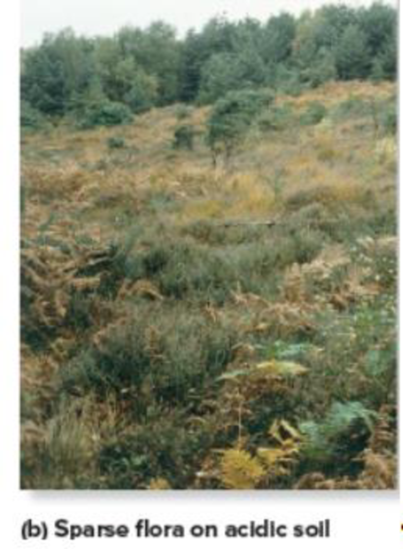
Core Skill: Connections Look ahead to Figure 54.14. The plant life shown growing in part (b) of that figure is sparse because the soil is very acidic. If the pH of the soil were 5.0, what would the H+ concentration be?

Expert Solution & Answer
Want to see the full answer?
Check out a sample textbook solution
Students have asked these similar questions
Explain:
Healthy Cell Function Overview→ Briefly describe how a healthy cell usually works: metabolism (ATP production), pH balance, glycogen storage, ion transport, enzymes, etc.
Gene Mutation and Genetics Part→ Focus on the autosomal recessive mutation and explain:
How gene mutation affects the cell.
How autosomal inheritance works.
Compare the normal and mutated gene sequences simply. → Talk about possible consequences of a faulty hydrolytic enzyme.
Can you fill out those terms
Explain down bellow what happens to the cell:
Decreased pH in mitochondria
Increased ATP
Decreased pH in cytosol
Increased hydrolysis
Decreasing glycogen and triglycerides
Increased MAP kinase activity
Poor ion transport → For each one:→ What normally happens?→ What is wrong now?→ How does it mess up the cell?
Chapter 2 Solutions
Biology
Ch. 2.1 - Before the experiment conducted by Ernest...Ch. 2.1 - What was the hypothesis tested by Rutherford?Ch. 2.1 - Prob. 3EQCh. 2.1 - Explain the difference between an electron shell...Ch. 2.2 - Prob. 1CCCh. 2.2 - Prob. 2CCCh. 2.3 - When oil dissolves in a soapy solution, where is...Ch. 2.3 - Prob. 2CCCh. 2.3 - Core Skill: Connections Look ahead to Figure...Ch. 2 - _______________ make(s) up the nucleus of an atom....
Additional Science Textbook Solutions
Find more solutions based on key concepts
True or false? Some trails are considered vestigial because they existed long ago.
Biological Science (6th Edition)
Describe the role and impact of microbes on the earth.
Microbiology Fundamentals: A Clinical Approach
On what molecule does the anticodon appear? Explain the role of this molecule in protein synthesis.
Human Physiology: An Integrated Approach (8th Edition)
60. The solar system is 25,000 light years from the center of our Milky Way galaxy. One light year is the dista...
Physics for Scientists and Engineers: A Strategic Approach, Vol. 1 (Chs 1-21) (4th Edition)
What process causes the Mediterranean intermediate Water MIW to become more dense than water in the adjacent At...
Applications and Investigations in Earth Science (9th Edition)
Why do scientists think that all forms of life on earth have a common origin?
Genetics: From Genes to Genomes
Knowledge Booster
Learn more about
Need a deep-dive on the concept behind this application? Look no further. Learn more about this topic, biology and related others by exploring similar questions and additional content below.Similar questions
- An 1100 pound equine patient was given 20 mg/kg sucralfate 3 times a day, 2.8 mg/kg famotidine twice a day, and 10mg/kg doxycycline twice a day. Sucralfate comes as a 1 gm tablet, famotidine as 20 mg tablets, and doxycycline as 100mg tablets. All are in bottles of 100 tablets.How many total mg are needed for the patient and how many tablets of each would be needed to provide each dose?How many bottles of each would be needed to have available if this patient were to be on this drug regimen for 5 days?arrow_forwardThe patient needs a solution of 2.5% dextrose in Lactated Ringer’s solution to run at 75 ml/hr for at least the next 12hours. LRS comes in fluid bags of 500 ml, 1 Liter, 3 Liters and 5 Liters. How can a 2.5% solution be made by adding50% dextrose to the LRS?arrow_forward“Gretchen” was a 68-pound canine who came to the VMTH as small animal surgery patient. She receivedacepromazine, 0.2 mg/kg from a 10 mg/ml solution and oxymorphone, 0.08 mg/kg from a 1 mg/ml solution before surgery.What are the mechanisms of action of acepromazine and oxymorphone? Why would they be given together?How many mg provide each dose and how many ml of each of these solutions were given?arrow_forward
- After surgery, “Gretchen” was put on carprofen, 1 mg/pound bid (twice a day). The tablets come in 25, 75 and 100 mgsizes. Which size tablet would be appropriate?What is the mechanism of action of carprofen?An outpatient prescription was written for her so she would have enough for 10 days. How many tablets did she need?What information needs to be on her out-patient prescription?arrow_forwardJoden Koepp olor in chickens is due to incomplete dominance. BB = Black chicken, WW = White BLOOD TYPES Arhite chicken is In humans, Rh positive blood is dominant (R) over Rh negative blood (r). A man with type 0, Rh positive blood (whose mother had Rh negative blood), marries a woman with type AB, Rh negative blood. Several children were born. is? R R Genotypes Phenotypes RRR RR Rr Rr 4/16 RR R RR RK Rr Rr 4/16 rr 3/4 Rh posi 1/4 Rh negu 1/2 Rr rr rr rrrr 88 888 75 e genotype of the man? the genotype of the woman? The mother of the man had type AB blood.arrow_forwardPlease indentify the unknown organismarrow_forward
- 5G JA ATTC 3 3 CTIA A1G5 5 GAAT I I3 3 CTIA AA5 Fig. 5-3: The Eco restriction site (left) would be cleaved at the locations indicated by the arrows. However, a SNP in the position shown in gray (right) would prevent cleavage at this site by EcoRI One of the SNPs in B. rapa is found within the Park14 locus and can be detected by RFLP analysis. The CT polymorphism is found in the intron of the Bra013780 gene found on Chromosome 1. The Park14 allele with the "C" in the SNP has two EcoRI sites and thus is cleaved twice by EcoRI If there is a "T" in that SNP, one of the EcoRI sites is altered, so the Park14 allele with the T in the SNP has only one EcoRI site (Fig. 5-3). Park14 allele with SNP(C) Park14 allele with SNPT) 839 EcoRI 1101 EcoRI 839 EcoRI Fig. 5.4: Schematic restriction maps of the two different Park14 alleles (1316 bp long) of B. rapa. Where on these maps is the CT SNP located? 90 The primers used to amplify the DNA at the Park14 locus (see Fig. 5 and Table 3 of Slankster et…arrow_forwardFrom your previous experiment, you found that this enhancer activates stripe 2 of eve expression. When you sequence this enhancer you find several binding sites for the gap gene, Giant. To test how Giant interacts with eve, you decide to remove all of the Giant binding sites from the eve enhancer. What results do you expect to see with respect to eve expression?arrow_forwardWhat experiment could you do to see if the maternal gene, bicoid, is sufficient to form anterior fates?arrow_forward
arrow_back_ios
SEE MORE QUESTIONS
arrow_forward_ios
Recommended textbooks for you
 Biology: The Dynamic Science (MindTap Course List)BiologyISBN:9781305389892Author:Peter J. Russell, Paul E. Hertz, Beverly McMillanPublisher:Cengage Learning
- Case Studies In Health Information ManagementBiologyISBN:9781337676908Author:SCHNERINGPublisher:CengageBasic Clinical Lab Competencies for Respiratory C...NursingISBN:9781285244662Author:WhitePublisher:Cengage

Biology: The Dynamic Science (MindTap Course List)
Biology
ISBN:9781305389892
Author:Peter J. Russell, Paul E. Hertz, Beverly McMillan
Publisher:Cengage Learning


Case Studies In Health Information Management
Biology
ISBN:9781337676908
Author:SCHNERING
Publisher:Cengage


Basic Clinical Lab Competencies for Respiratory C...
Nursing
ISBN:9781285244662
Author:White
Publisher:Cengage
Explore Terrestrial Habitats - Types of Habitats for Children; Author: Smile and Learn - English;https://www.youtube.com/watch?v=vv1indKgOHQ;License: Standard youtube license