
Connect Plus Statistics Hosted by ALEKS Access Card 52 Weeks for Elementary Statistics: A Step-By-St
9th Edition
ISBN: 9781259198946
Author: Bluman, Allan
Publisher: McGraw-Hill Science/Engineerin
expand_more
expand_more
format_list_bulleted
Videos
Textbook Question
Chapter 2.3, Problem 18E
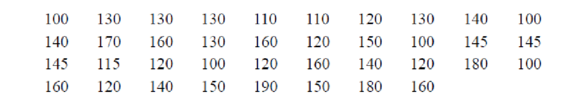
Calories in Salad Dressings A listing of calories per 1 ounce of selected salad dressings (not fat-free) is given below. Construct a stem and leaf plot for the data.
Expert Solution & Answer
Want to see the full answer?
Check out a sample textbook solution
Students have asked these similar questions
Suppose that you want to put fat Fido on a
weight-loss program. Before the program,
his weight had a standard score of +2 com-
pared to dogs of his breed/age, and after
the program, his weight has a standard
score of -2. His weight before the program
was 150 pounds, and the standard deviation
for the breed is 5 pounds.
a. What's the mean weight for Fido's breed/
age?
b. What's his weight after the weight-loss
program?
Weights have a normal distribution with a
mean of 100 and standard deviation of 10.
What weight has 60 percent of the values
lying below it?
The times it takes to complete a statistics
exam have a normal distribution with a
mean of 40 minutes and standard deviation
of 6 minutes. Deshawn's time falls at the
42nd percentile. How long does Deshawn
take to finish her exam?
bad boy wod
abbed a le signe ne tolgikiwo
(ezonipuo
brit of heen ugy shies von no
rep
on ud af
vt to into Or festes
e
a
(92) 00
Chapter 2 Solutions
Connect Plus Statistics Hosted by ALEKS Access Card 52 Weeks for Elementary Statistics: A Step-By-St
Ch. 2.1 - Ages of Presidents at Inauguration The data...Ch. 2.1 - List five reasons for organizing data into a...Ch. 2.1 - Name the three types of frequency distributions,...Ch. 2.1 - How many classes should frequency distributions...Ch. 2.1 - What are open-ended frequency distributions? Why...Ch. 2.1 - Prob. 5ECh. 2.1 - For Exercises 58, find the class boundaries,...Ch. 2.1 - Prob. 7ECh. 2.1 - For Exercises 58, find the class boundaries,...Ch. 2.1 - Prob. 9E
Ch. 2.1 - For Exercises 912, show frequency distributions...Ch. 2.1 - Prob. 11ECh. 2.1 - For Exercises 912, show frequency distributions...Ch. 2.1 - Prob. 13ECh. 2.1 - Trust in Internet Information A survey was taken...Ch. 2.1 - Eating at Fast Food Restaurants A survey was taken...Ch. 2.1 - Ages of Dogs The ages of 20 dogs in a pet shelter...Ch. 2.1 - Prob. 17ECh. 2.1 - Stories in the Worlds Tallest Buildings The number...Ch. 2.1 - Ages of Declaration of Independence Signers The...Ch. 2.1 - Salaries of Governors Here are the salaries (in...Ch. 2.1 - Charity Donations A random sample of 30 large...Ch. 2.1 - Unclaimed Expired Prizes The number of unclaimed...Ch. 2.1 - Prob. 23ECh. 2.1 - Consumption of Natural Gas Construct a frequency...Ch. 2.1 - Average Wind Speeds A sample of 40 large cities...Ch. 2.1 - Percentage of People Who Completed 4 or More Years...Ch. 2.1 - JFK Assassination A researcher conducted a survey...Ch. 2.1 - The Value of Pi The ratio of the circumference of...Ch. 2.2 - Selling Real Estate Assume you are a realtor in...Ch. 2.2 - Do Students Need Summer Development? For 108...Ch. 2.2 - Prob. 2ECh. 2.2 - Prob. 3ECh. 2.2 - Number of College Faculty The number of faculty...Ch. 2.2 - Railroad Crossing Accidents The data show the...Ch. 2.2 - NFL Salaries The salaries (in millions of dollars)...Ch. 2.2 - Prob. 7ECh. 2.2 - Costs of Utilities The frequency distribution...Ch. 2.2 - Air Pollution One of the air pollutants that is...Ch. 2.2 - Making the Grade The frequency distributions shown...Ch. 2.2 - Blood Glucose Levels The frequency distribution...Ch. 2.2 - Waiting Times The frequency distribution shows the...Ch. 2.2 - Construct a histogram, frequency polygon, and...Ch. 2.2 - Construct a histogram, frequency polygon, and...Ch. 2.2 - Construct a histogram, frequency polygon, and...Ch. 2.2 - Construct a histogram, frequency polygon, and...Ch. 2.2 - Prob. 17ECh. 2.2 - Protein Grams in Fast Food The amount of protein...Ch. 2.2 - Using the histogram shown here, do the following....Ch. 2.2 - Using the results from Exercise 19. answer these...Ch. 2.2 - Math SAT Scores Shown is an ogive depicting the...Ch. 2.3 - Applying the Concepts 23 Causes of Accidental...Ch. 2.3 - Prob. 1ECh. 2.3 - Worldwide Sales of Fast Foods The worldwide sales...Ch. 2.3 - Prob. 3ECh. 2.3 - Roller Coaster Mania The World Roller Coaster...Ch. 2.3 - Prob. 5ECh. 2.3 - Violent Crimes The number of all violent crimes...Ch. 2.3 - Prob. 7ECh. 2.3 - Valentines Day Spending The data show the average...Ch. 2.3 - Prob. 9ECh. 2.3 - Reasons We Travel The following data are based on...Ch. 2.3 - Prob. 11ECh. 2.3 - Colors of Automobiles The popular car colors are...Ch. 2.3 - Prob. 13ECh. 2.3 - Prob. 14ECh. 2.3 - Years of Experience The data show the number of...Ch. 2.3 - Commuting Times Fifty off-campus students were...Ch. 2.3 - Home Run Club There are 43 Major League baseball...Ch. 2.3 - Calories in Salad Dressings A listing of calories...Ch. 2.3 - Length of Major Rivers The data show the lengths...Ch. 2.3 - Math and Reading Achievement Scores The math and...Ch. 2.3 - State which type of graph (Pareto chart, time...Ch. 2.3 - State which graph (Pareto chart, time series...Ch. 2.3 - Prob. 23ECh. 2.3 - Prob. 24ECh. 2.3 - Cost of Milk The graph shows the increase in the...Ch. 2.3 - U.S. Population by Age The following information...Ch. 2.3 - Prob. 27ECh. 2.3 - Trip Reimbursements The average amount requested...Ch. 2 - How People Get Their News The Brunswick Research...Ch. 2 - Mens World Hockey Champions The United States won...Ch. 2 - BUN Count The blood urea nitrogen (BUN) count of...Ch. 2 - Wind Speed The data show the average wind speed...Ch. 2 - Prob. 2.1.5RECh. 2 - Ages of the Vice Presidents at the Time of Their...Ch. 2 - Prob. 2.2.7RECh. 2 - Find the relative frequency for the frequency...Ch. 2 - Construct a histogram, frequency polygon, and...Ch. 2 - Construct a histogram, frequency polygon, and...Ch. 2 - Construct a histogram, frequency polygon, and...Ch. 2 - Construct a histogram, frequency polygon, and...Ch. 2 - Prob. 2.3.13RECh. 2 - Calories of Nuts The data show the number of...Ch. 2 - Prob. 2.3.15RECh. 2 - AID: 1825 | 31/5/2018 16. Pet Care The data (in...Ch. 2 - Prob. 2.3.17RECh. 2 - Prob. 2.3.18RECh. 2 - Prob. 2.3.19RECh. 2 - Prob. 2.3.20RECh. 2 - Prob. 2.3.21RECh. 2 - Prob. 2.3.22RECh. 2 - Prob. 2.3.23RECh. 2 - Public Libraries The numbers of public libraries...Ch. 2 - Pain Relief The graph below shows the time it...Ch. 2 - Casino Payoffs The graph shows the payoffs...Ch. 2 - From the Data Bank located in Appendix B, choose...Ch. 2 - Prob. 2DACh. 2 - From the Data Bank, select at least 30 subjects...Ch. 2 - Prob. 4DACh. 2 - Using the data from Data Set XI in Appendix B,...Ch. 2 - Prob. 7DACh. 2 - Determine whether each statement is true or false....Ch. 2 - Prob. 2CQCh. 2 - Prob. 3CQCh. 2 - Frequency distributions can aid the researcher in...Ch. 2 - Determine whether each statement is true or false....Ch. 2 - Prob. 6CQCh. 2 - Determine whether each statement is true or false....Ch. 2 - Prob. 8CQCh. 2 - What are the boundaries for 8.68.8? a. 89 b....Ch. 2 - What graph should be used to show the relationship...Ch. 2 - Prob. 11CQCh. 2 - The three types of frequency distributions are...Ch. 2 - In a frequency distribution, the number of classes...Ch. 2 - Prob. 14CQCh. 2 - Data collected over a period of time can be...Ch. 2 - A statistical device used in exploratory data...Ch. 2 - On a Pareto chart, the frequencies should be...Ch. 2 - Housing Arrangements A questionnaire on housing...Ch. 2 - Housing Arrangements A questionnaire on housing...Ch. 2 - Prob. 20CQCh. 2 - Construct a histogram, a frequency polygon, and an...Ch. 2 - Coal Consumption The following data represent the...Ch. 2 - Construct a histogram, frequency polygon, and...Ch. 2 - Recycled Trash Construct a Pareto chart and a...Ch. 2 - Identity Thefts The results of a survey of 84...Ch. 2 - Needless Deaths of Children The New England...Ch. 2 - Prob. 27CQCh. 2 - Parking Meter Revenue In a small city the number...Ch. 2 - Prob. 29CQCh. 2 - The Great Lakes Shown are various statistics about...Ch. 2 - Teacher Strikes In Pennsylvania there were more...
Knowledge Booster


Learn more about
Need a deep-dive on the concept behind this application? Look no further. Learn more about this topic, statistics and related others by exploring similar questions and additional content below.Similar questions
- Jimmy walks a mile, and his previous times have a normal distribution with a mean of 8 minutes and standard deviation of 1 minute. What time does he have to make to get into his own top 10 percent of his fastest times?arrow_forwardEarrow_forwardStatcars have a miles per gallon normal distribution with a mean of 75. Twenty percent of the vehicles get more than 100 miles per gallon. What's the standard deviation?arrow_forward
- 6 Exam scores for a particular test have a normal distribution with a mean of 75 and standard deviation of 5. The instructor swants to give the top 20 percent of the scores an A. What's the cutoff for an A? dong lemon 2 ob of onlyarrow_forward42 68 (F) Round to the mean as needed Class Frequency, f Midpoint Relative frequency Cumulative frequency 17:27 18 22 0.05 18 28-38 42 ☐arrow_forwardA study investigating a new test for diagnosing acute myocardial infarction (AMI) has just been initiated. The sensitivity of the test is estimated at 75% and the specificity at 80%. The study enrolls 600 patients, of whom 200 are confirmed AMI cases as determined by the diagnostic gold standard. How many false negatives are to be expected in the study? A. 50 B. 80 C. 120 D. 150 E. 400arrow_forward
- choose the correct graph belowarrow_forwardC4 Q6 V1: Randomly collected student data in the dataset STATISTICSSTUDENTSSURVEYFORR contains the columns FEDBEST (preferred Federal party (Conservative, Green, Liberals, or NDP) ) , UNDERGORGRAD (degree being sought (GraduateProfessional, Undergraduate) ) and GENDERIDENTITY (Female or Male or Other). Make a crosstab (contingency) table of the counts for each of the (UNDERGORGRAD, FEDBEST) pairs for ONLY the females. If we randomly select a female student who is pursuing a graduateprofessional degree, what is the probability that she prefers the Federal Liberals. Choose the most correct (closest) answer below. Question 6 Answer a. 0.128 b. 0.263 c. 0.744 d. 0.333arrow_forwardInstall RStudio: Begin by installing RStudio on your computer. If you haven't done so, please refer to the official RStudio website for download and installation instructions. Watch the Tutorial Video: Watch the provided video tutorial that explains how to run RStudio. Pay close attention to the steps for opening and managing data files. https://www.youtube.com/watch?v=RhJp6vSZ7z0 Open RStudio: Once RStudio is installed, open the application. Load the Dataset: In RStudio, open a data file named "mtcars". To do this, type the command mtcars in the script editor and run the command. Attach the Data: Next, attach the dataset using the command attach(mtcars). Examine the Variables: Carefully review and note the names of all variables in the dataset. Examples of these variables include: Mileage (mpg) Number of Cylinders (cyl) Displacement (disp) Horsepower (hp) Research: Google to understand these variables. Statistical Analysis: Select mpg variable, and perform the following…arrow_forward
- A marketing professor has surveyed the students at her university to better understand attitudes towards PPT usage for higher education. To be able to make inferences to the entire student body, the sample drawn needs to represent the university’s student population on all key characteristics. The table below shows the five key student demographic variables. The professor found the breakdown of the overall student body in the university’s fact book posted online. A non-parametric chi-square test was used to test the sample demographics against the population percentages shown in the table above. Review the output for the five chi-square tests on the following pages and answer the five questions: Based on the chi-square test, which sample variables adequately represent the university’s student population and which ones do not? Support your answer by providing the p-value of the chi-square test and explaining what it means. Using the results from Question 1, make recommendation for…arrow_forwardA marketing professor has surveyed the students at her university to better understand attitudes towards PPT usage for higher education. To be able to make inferences to the entire student body, the sample drawn needs to represent the university’s student population on all key characteristics. The table below shows the five key student demographic variables. The professor found the breakdown of the overall student body in the university’s fact book posted online. A non-parametric chi-square test was used to test the sample demographics against the population percentages shown in the table above. Review the output for the five chi-square tests on the following pages and answer the five questions: Based on the chi-square test, which sample variables adequately represent the university’s student population and which ones do not? Support your answer by providing the p-value of the chi-square test and explaining what it means. Using the results from Question 1, make recommendation for…arrow_forwardA retail chain is interested in determining whether a digital video point-of-purchase (POP) display would stimulate higher sales for a brand advertised compared to the standard cardboard point-of-purchase display. To test this, a one-shot static group design experiment was conducted over a four-week period in 100 different stores. Fifty stores were randomly assigned to the control treatment (standard display) and the other 50 stores were randomly assigned to the experimental treatment (digital display). Compare the sales of the control group (standard POP) to the experimental group (digital POP). What were the average sales for the standard POP display (control group)? What were the sales for the digital display (experimental group)? What is the (mean) difference in sales between the experimental group and control group? List the null hypothesis being tested. Do you reject or retain the null hypothesis based on the results of the independent t-test? Was the difference between the…arrow_forward
arrow_back_ios
SEE MORE QUESTIONS
arrow_forward_ios
Recommended textbooks for you
 Glencoe Algebra 1, Student Edition, 9780079039897...AlgebraISBN:9780079039897Author:CarterPublisher:McGraw Hill
 Holt Mcdougal Larson Pre-algebra: Student Edition...AlgebraISBN:9780547587776Author:HOLT MCDOUGALPublisher:HOLT MCDOUGAL
 Big Ideas Math A Bridge To Success Algebra 1: Stu...AlgebraISBN:9781680331141Author:HOUGHTON MIFFLIN HARCOURTPublisher:Houghton Mifflin Harcourt
 College Algebra (MindTap Course List)AlgebraISBN:9781305652231Author:R. David Gustafson, Jeff HughesPublisher:Cengage Learning
Glencoe Algebra 1, Student Edition, 9780079039897...
Algebra
ISBN:9780079039897
Author:Carter
Publisher:McGraw Hill
Holt Mcdougal Larson Pre-algebra: Student Edition...
Algebra
ISBN:9780547587776
Author:HOLT MCDOUGAL
Publisher:HOLT MCDOUGAL
Big Ideas Math A Bridge To Success Algebra 1: Stu...
Algebra
ISBN:9781680331141
Author:HOUGHTON MIFFLIN HARCOURT
Publisher:Houghton Mifflin Harcourt
College Algebra (MindTap Course List)
Algebra
ISBN:9781305652231
Author:R. David Gustafson, Jeff Hughes
Publisher:Cengage Learning
Hypothesis Testing using Confidence Interval Approach; Author: BUM2413 Applied Statistics UMP;https://www.youtube.com/watch?v=Hq1l3e9pLyY;License: Standard YouTube License, CC-BY
Hypothesis Testing - Difference of Two Means - Student's -Distribution & Normal Distribution; Author: The Organic Chemistry Tutor;https://www.youtube.com/watch?v=UcZwyzwWU7o;License: Standard Youtube License