
Concept explainers
Videos
Is there a relationship between wine consumption and deaths from heart disease? The table gives data from 19 developed countries.
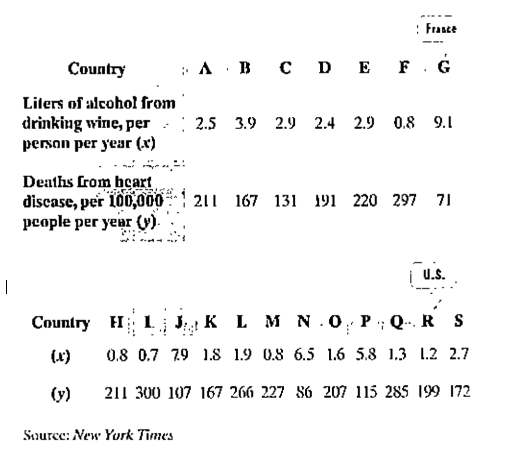
a. Use the statistical menu of your graphing utility to enter the 19 ordered pairs of data items shown in the table.
b. Use the
c. Select the linear regression option. Use your utility to obtain values for a and b for the equation of the regression line,
. You may also be given a
d. Use the appropriate sequence (consult your manual) to graph the regression equation on top of the points in the scatter plot.
Want to see the full answer?
Check out a sample textbook solution
Chapter 2 Solutions
Algebra and Trigonometry (6th Edition)


- 6. Find the time it will take $1000 to grow to $5000 at an interest rate of 3.5% if the interest is compounded a) quarterly b) continuouslyarrow_forward. Find how many years it takes for $1786 to grow to $2063 if invested at 2.6% annual interest compounded monthly. 12+arrow_forward(1) Let M and N be non-empty subsets of a linear space X, show that whether = U or not, and show that there whether exsits a liear function from P₂(x) into R' which onto but not one-to-one or not. ام (2) Let R be a field of real numbers and P,(x)=(a+bx+cx? / a,b,ce R} be a vector space over R, show that whether there exsit two hyperspaces A and B such that AUB is a hyperspace or not. (3) Let A be an affine set in a linear space X over afield F and tEA, show that A-t is a subspace of Xand show that if M and N are balanced sets then M+N is balanced set. (4) Write the definition of bounded set in a normed space, and write with prove an equivalent statement to definition. (5) Let d be a metric on a linear space X over a field F, write conditions on d in order to get that there is a norm on X induced dy d and prove that. (6) Let M be a non-empty subset of a normed space X, show that xEcl(M) iff for any r>o there exsits yEM such that llx-yllarrow_forwardFind all solutions to the following equation. Do you get any extraneous solutions? Explain why or why not. 2 2 + x+1x-1 x21 Show all steps in your process. Be sure to state your claim, provide your evidence, and provide your reasoning before submitting.arrow_forwardDirections: For problems 1 through 3, read each question carefully and be sure to show all work. 1. What is the phase shift for y = 2sin(2x-)? 2. What is the amplitude of y = 7cos(2x+л)? 3. What is the period of y = sin(3x-π)? Directions: For problems 4 and 5, you were to compare and contrast the two functions in each problem situation. Be sure to include a discussion of similarities and differences for the periods, amplitudes, y-minimums, y-maximums, and any phase shift between the two graphs. Write in complete sentences. 4. y 3sin(2x) and y = 3cos(2x) 5. y 4sin(2x) and y = cos(3x- -플)arrow_forward2. Find the exact value of 12 + 12+12+√√12+ √12+ 12arrow_forwardTechnetium-99m is used as a radioactive tracer for certain medical tests. It has a half-life of 1 day. Consider the function TT where T(d)T(d) =100(2)−d=100(2)−d is the percent of Technetium-99m remaining dd days after the test. Which expression represents the number of days until only 5% remains?arrow_forward1. Find the inverse of f(x) = = 2x 1+2x Then find the domain of the inverse.arrow_forwardLet S = be a set of k vectors in R^, with karrow_forwarda) [1√2-31x+1√3-11y = x (1 - √2) + √34 LI√2-21x-1√3-3/4= √34 - √2x-4arrow_forwardPlease Help me answer this linear algebra question. This is a practice textbook question.arrow_forward1. a scientist observed a bacterium in a microscope. it measured about .0000029 meter in diameter which of the following is closest to it? A- 2 x 10^-6, B- 2 x 10^-5, C- 3 x 10^-5, or D- 3 x 10^-6 2.express the product of 500 and 400 in scientific notation. is it 2 x 10^5 or 2 x 10^4 or 2 x 10^3 or 20 x 10^4arrow_forwardarrow_back_iosSEE MORE QUESTIONSarrow_forward_iosRecommended textbooks for you
 Glencoe Algebra 1, Student Edition, 9780079039897...AlgebraISBN:9780079039897Author:CarterPublisher:McGraw Hill
 Functions and Change: A Modeling Approach to Coll...AlgebraISBN:9781337111348Author:Bruce Crauder, Benny Evans, Alan NoellPublisher:Cengage Learning
 Algebra and Trigonometry (MindTap Course List)AlgebraISBN:9781305071742Author:James Stewart, Lothar Redlin, Saleem WatsonPublisher:Cengage Learning
 Algebra & Trigonometry with Analytic GeometryAlgebraISBN:9781133382119Author:SwokowskiPublisher:Cengage
 Big Ideas Math A Bridge To Success Algebra 1: Stu...AlgebraISBN:9781680331141Author:HOUGHTON MIFFLIN HARCOURTPublisher:Houghton Mifflin Harcourt
Glencoe Algebra 1, Student Edition, 9780079039897...AlgebraISBN:9780079039897Author:CarterPublisher:McGraw HillFunctions and Change: A Modeling Approach to Coll...AlgebraISBN:9781337111348Author:Bruce Crauder, Benny Evans, Alan NoellPublisher:Cengage LearningAlgebra and Trigonometry (MindTap Course List)AlgebraISBN:9781305071742Author:James Stewart, Lothar Redlin, Saleem WatsonPublisher:Cengage LearningAlgebra & Trigonometry with Analytic GeometryAlgebraISBN:9781133382119Author:SwokowskiPublisher:CengageBig Ideas Math A Bridge To Success Algebra 1: Stu...AlgebraISBN:9781680331141Author:HOUGHTON MIFFLIN HARCOURTPublisher:Houghton Mifflin Harcourt