The wage gap is used to compare the status of women's comings relative to men's. The wage gap is expressed as a percent and is calculated by dividing the median, or middlemost, annual earnings for women by the median annual earnings for men. The bar graph shows the wage gap for selected years from 1980 through 2010. The function G ( x ) = − 0.01 x 2 + x + 60 models the wage gap, as a percent, x years after 1980. The graph of function G is shown to the night of the actual data. Use this information to solve Exercises 103-101. a. find and interpret G (10). Identify this information as a point on the graph of the function. b. Does G (10) overestimate the actual data shown by the graph? By how much?
The wage gap is used to compare the status of women's comings relative to men's. The wage gap is expressed as a percent and is calculated by dividing the median, or middlemost, annual earnings for women by the median annual earnings for men. The bar graph shows the wage gap for selected years from 1980 through 2010. The function G ( x ) = − 0.01 x 2 + x + 60 models the wage gap, as a percent, x years after 1980. The graph of function G is shown to the night of the actual data. Use this information to solve Exercises 103-101. a. find and interpret G (10). Identify this information as a point on the graph of the function. b. Does G (10) overestimate the actual data shown by the graph? By how much?
Solution Summary: The author calculates the value of G(x) for the function underset_69.
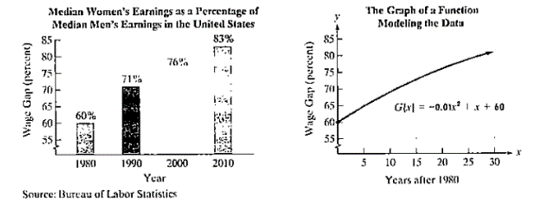
The wage gap is used to compare the status of women's comings relative to men's. The wage gap is expressed as a percent and is calculated by dividing the median, or middlemost, annual earnings for women by the median annual earnings for men. The bar graph shows the wage gap for selected years from 1980 through 2010.
The function
G
(
x
)
=
−
0.01
x
2
+
x
+
60
models the wage gap, as a percent, x years after 1980. The graph of function G is shown to the night of the actual data. Use this information to solve Exercises 103-101.
a. find and interpret G (10). Identify this information as a point on the graph of the function.
b. Does G (10) overestimate the actual data shown by the graph? By how much?
12:01 PM Tue May 13
<
AA
✓ Educatic S s3.amazona... A Assess Your...
目
accelerate-iu15-bssd.vschool.com
S s3.amazona...
Trigonometric Identities Module Exam
Dashboard ...
Dashboard ...
Algebra 2 Pa...
Algebra 2 Part 4 [Honors] (Acc. Ed.) (Zimmerman) 24-25 / Module 11: Trigonometric Identities
i
+
38%
✰ Start Page
Alexis
Forsythe
All changes saved
10. A sound wave's amplitude can be modeled by the function y = −7 sin ((x-1) + 4). Within the interval 0 < x < 12, when does the function have an amplitude
of 4? (Select all that apply.)
9.522 seconds
4.199 seconds
0.522 seconds
1.199 seconds
Previous
10 of 20
Next
Jamal wants to save $48,000 for a down payment on a home. How much will he need to invest in an
account with 11.8% APR, compounding daily, in order to reach his goal in 10 years? Round to the
nearest dollar.
r
nt
Use the compound interest formula, A (t) = P(1 + 1)".
An account is opened with an intial deposit of $7,500 and earns 3.8% interest compounded semi-
annually. Round all answers to the nearest dollar.
a. What will the account be worth in 10 years? $
b. What if the interest were compounding monthly? $
c. What if the interest were compounded daily (assume 365 days in a year)? $
Need a deep-dive on the concept behind this application? Look no further. Learn more about this topic, algebra and related others by exploring similar questions and additional content below.


 Glencoe Algebra 1, Student Edition, 9780079039897...AlgebraISBN:9780079039897Author:CarterPublisher:McGraw Hill
 Big Ideas Math A Bridge To Success Algebra 1: Stu...AlgebraISBN:9781680331141Author:HOUGHTON MIFFLIN HARCOURTPublisher:Houghton Mifflin Harcourt
 Holt Mcdougal Larson Pre-algebra: Student Edition...AlgebraISBN:9780547587776Author:HOLT MCDOUGALPublisher:HOLT MCDOUGAL
 College Algebra (MindTap Course List)AlgebraISBN:9781305652231Author:R. David Gustafson, Jeff HughesPublisher:Cengage Learning