DATA In one experiment the electric field is measured for points at distances r from a uniform line of charge that has charge per unit length λ and length l , where l >> r . In a second experiment the electric field is measured for points at distances r from the center of a uniformly charged insulating sphere that has volume charge density ρ and radius R = 8.00 mm, where r > R . The results of the two measurements are listed in the table, but you aren’t told which set of data applies to which experiment: For each set of data, draw two graphs: one for Er 2 versus r and one for Er versus r . (a) Use these graphs to determine which data set, A or B, is for the uniform line of charge and which set is for the uniformly charged sphere. Explain your reasoning. (b) Use the graphs in part (a) to calculate λ for the uniform line of charge and ρ for the uniformly charged sphere.
DATA In one experiment the electric field is measured for points at distances r from a uniform line of charge that has charge per unit length λ and length l , where l >> r . In a second experiment the electric field is measured for points at distances r from the center of a uniformly charged insulating sphere that has volume charge density ρ and radius R = 8.00 mm, where r > R . The results of the two measurements are listed in the table, but you aren’t told which set of data applies to which experiment: For each set of data, draw two graphs: one for Er 2 versus r and one for Er versus r . (a) Use these graphs to determine which data set, A or B, is for the uniform line of charge and which set is for the uniformly charged sphere. Explain your reasoning. (b) Use the graphs in part (a) to calculate λ for the uniform line of charge and ρ for the uniformly charged sphere.
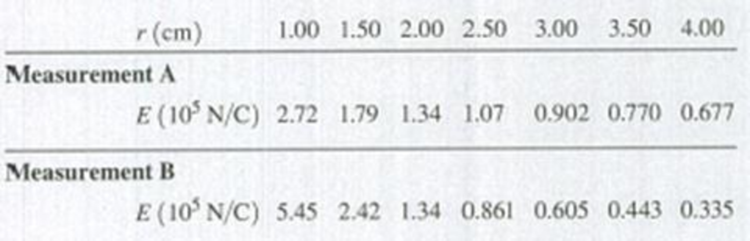
DATA In one experiment the electric field is measured for points at distances r from a uniform line of charge that has charge per unit length λ and length l, where l >> r. In a second experiment the electric field is measured for points at distances r from the center of a uniformly charged insulating sphere that has volume charge density ρ and radius R = 8.00 mm, where r > R. The results of the two measurements are listed in the table, but you aren’t told which set of data applies to which experiment:
For each set of data, draw two graphs: one for Er2 versus r and one for Er versus r. (a) Use these graphs to determine which data set, A or B, is for the uniform line of charge and which set is for the uniformly charged sphere. Explain your reasoning. (b) Use the graphs in part (a) to calculate λ for the uniform line of charge and ρ for the uniformly charged sphere.
Race car driver is cruising down the street at a constant speed of 28.9 m/s (~65 mph; he has a “lead” foot) when the traffic light in front of him turns red. a) If the driver’s reaction time is 160 ms, how far does he and his car travel down the road from the instant he sees the light change to the instant he begins to slow down? b) If the driver’s combined reaction and movement time is 750 ms, how far do he and his car travel down the road from the instant he sees the light change to the instant he slams on her brakes and car begins to slow down? c) If the driver’s average rate of acceleration is -9.5 m/s2 as he slows down, how long does it take him to come to a stop (use information about his speed of 28.9 m/s but do NOT use his reaction and movement time in this computation)? Please answer parts a-c. Show all work. For each question draw a diagram to show the vector/s. Show all the step and provide units in the answers. Provide answer to 2 decimal places unless stated otherwise.
In the Donkey Kong Country video games you often get around by shooting yourself out of barrel cannons. Donkey Kong wants to launch out of one barrel and land in a different one that is a distance in x of 9.28 m away. To do so he launches himself at a velocity of 22.6 m/s at an angle of 30.0°. At what height does the 2nd barrel need to be for Donkey Kong to land in it? (measure from the height of barrel 1, aka y0=0)
Below you will find 100 m split times for the American and France men’s 4x100 meter free style relay race during the 2008 Beijing Summer Olympics). Answer questions a-d. a) What was the total race time for each team, in seconds? b) Which team won the race? What was the difference in the teams’ times? c) What was the average speed for each team for the whole race? (provide answer to 3 decimal places). d) Calculate the average speed for each swimmer and report the results in a table like the one above. Remember to show the calculation steps. (provide answer to 3 decimal places). PLEASE SHOW ALL WORK AND STEPS.
Need a deep-dive on the concept behind this application? Look no further. Learn more about this topic, physics and related others by exploring similar questions and additional content below.


 Physics for Scientists and Engineers: Foundations...PhysicsISBN:9781133939146Author:Katz, Debora M.Publisher:Cengage Learning
 Principles of Physics: A Calculus-Based TextPhysicsISBN:9781133104261Author:Raymond A. Serway, John W. JewettPublisher:Cengage Learning
 College PhysicsPhysicsISBN:9781305952300Author:Raymond A. Serway, Chris VuillePublisher:Cengage Learning
 Physics for Scientists and Engineers, Technology ...PhysicsISBN:9781305116399Author:Raymond A. Serway, John W. JewettPublisher:Cengage Learning
 Physics for Scientists and Engineers with Modern ...PhysicsISBN:9781337553292Author:Raymond A. Serway, John W. JewettPublisher:Cengage Learning