
Understanding Basic Statistics
8th Edition
ISBN: 9781337558075
Author: Charles Henry Brase, Corrinne Pellillo Brase
Publisher: Cengage Learning
expand_more
expand_more
format_list_bulleted
Concept explainers
Videos
Textbook Question
Chapter 2.2, Problem 1P
Interpretation Consider graph (a) of Reasons People Like Texting on Cell Phones, based on a GfK Roper survey of 1000 adults.
Reasons People Like Texting on Cell Phones
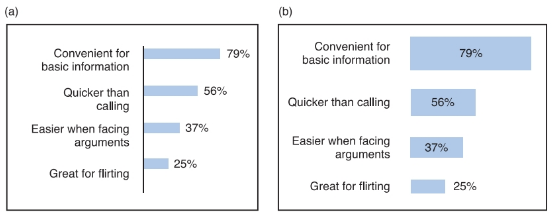
Do you think respondents could select more than one response? Explain.
Could the same information be displayed in a circle graph? Explain.
Is graph (a) a Pareto chart?
Expert Solution & Answer

Trending nowThis is a popular solution!

Students have asked these similar questions
Consider an event X comprised of three outcomes whose probabilities are 9/18, 1/18,and 6/18.
Compute the probability of the complement of the event.
Question content area bottom
Part 1
A.1/2
B.2/18
C.16/18
D.16/3
John and Mike were offered mints. What is the probability that at least John or Mike would respond favorably? (Hint: Use the classical definition.)
Question content area bottom
Part 1
A.1/2
B.3/4
C.1/8
D.3/8
The details of the clock sales at a supermarket for the past 6 weeks are shown in the table below. The time series appears to be relatively stable, without trend, seasonal, or cyclical effects. The simple moving average value of k is set at 2. What is the simple moving average root mean square error? Round to two decimal places.
Week
Units sold
1
88
2
44
3
54
4
65
5
72
6
85
Question content area bottom
Part 1
A.
207.13
B.
20.12
C.
14.39
D.
0.21
Chapter 2 Solutions
Understanding Basic Statistics
Ch. 2.1 - Statistical Literacy What is the difference...Ch. 2.1 - Statistical Literacy A data set has values ranging...Ch. 2.1 - Statistical Literacy A data set has values ranging...Ch. 2.1 - Statistical Literacy A data set has value ranging...Ch. 2.1 - Basic Computation: Class Limits A data set with...Ch. 2.1 - Basic Computation: Class limits A data set with...Ch. 2.1 - Interpretation You are manager of a specialty...Ch. 2.1 - Critical Thinking A web site rated 100 colleges...Ch. 2.1 - Critical Thinking Look at the histogram in Figure...Ch. 2.1 - Critical Thinking The following data represent...
Ch. 2.1 - Interpretation Histograms of random sample data...Ch. 2.1 - Interpretation The following histograms are based...Ch. 2.1 - Interpretation The ogives shown are based on U.S...Ch. 2.1 - Critical Thinking The following ogives come from...Ch. 2.1 - For Problems 15-20. use the specified number of...Ch. 2.1 - For Problems 15-20, use the specified number of...Ch. 2.1 - For Problems 15-20, use the specified number of...Ch. 2.1 - For Problems 15-20, use the specified number of...Ch. 2.1 - For Problems 15-20, use the specified number of...Ch. 2.1 - For Problems 15-20. use the specified number of...Ch. 2.1 - Expand Your knowledge: Decimal Data The fallowing...Ch. 2.1 - Decimal Data: Batting Averages The following data...Ch. 2.1 - Expand Your Knowledge: Dotplot another display...Ch. 2.1 - 24. Dotplot: Sled Dog Racing Make a dotplot for...Ch. 2.1 - Prob. 25PCh. 2.2 - 1. Interpretation Consider graph (a) of Reasons...Ch. 2.2 - Interpretation Look at graph (b) of Reasons People...Ch. 2.2 - Critical Thinking A personnel office is gathering...Ch. 2.2 - Critical Thinking Your friend is thinking about...Ch. 2.2 - Education: Does College Pay Off? It is costly in...Ch. 2.2 - Interpretation Consider the two graphs depicting...Ch. 2.2 - Commercial Fishing: Gulf of Alaska It's not an...Ch. 2.2 - Archaeology: Ireland Commercial dredging...Ch. 2.2 - Lifestyle: Hide the Mess! A survey of 1000 adults...Ch. 2.2 - Education: College Professors' Time How do college...Ch. 2.2 - FBI Report: Hawaii In the Aloha state, you are...Ch. 2.2 - Driving: Bad Habits Driving would be more pleasant...Ch. 2.2 - 13Ecology: Lakes Pyramid Lake, Nevada, is...Ch. 2.2 - Vital Statistics: Height How dies average height...Ch. 2.2 - Expand Your Knowledge Donut Pie Charts The book...Ch. 2.2 - Technology: Cars The following cluster bar graph...Ch. 2.3 - Cowboys: Longevity How long did real cowboys live?...Ch. 2.3 - Ecology: Habitat Wetlands offer a diversity of...Ch. 2.3 - Health Care: Hospitals The American Medical...Ch. 2.3 - Health Care: Hospitals Using the number of...Ch. 2.3 - Expand Your knowledge: Split Stem The Boston...Ch. 2.3 - Split Stem: Golf The U.S. Open Golf Tournament was...Ch. 2.3 - Are cigarettes bad for people? Cigarette smoking...Ch. 2.3 - Are cigarettes bad for people? Cigarette smoking...Ch. 2.3 - Are cigarettes bad for people? Cigarette smoking...Ch. 2.3 - Expand Your Knowledge: Back-to-Back Stem Plot In...Ch. 2 - Terminology Consider the following graph types:...Ch. 2 - Terminology Whichtype(s) of data can be shown in a...Ch. 2 - Terminology Which type(s) of data can be shown in...Ch. 2 - Terminology Which graphical display shows each...Ch. 2 - Terminology If a histogram is skewed left, more of...Ch. 2 - Terminology How are data plotted in a time-series...Ch. 2 - Critical Thinking Consider these types of graphs:...Ch. 2 - Critical Thinking A consumer interest group is...Ch. 2 - Critical Thinking Describe how data outliers might...Ch. 2 - Expand Your Knowledge How are dotplots and...Ch. 2 - Focus Problem: Fuel Economy Solve the focus...Ch. 2 - Criminal Justice: Prisoners The time plot in...Ch. 2 - IRS: Tax Returns Almost everyone files (or will...Ch. 2 - Law Enforcement: DUI Driving under the influence...Ch. 2 - Agriculture: Apple Trees The following data...Ch. 2 - Law: Corporation Lawsuits Many people say the...Ch. 2 - Archaeology: Tree-King DataThe Sand Canyon...Ch. 2 - Interpretation A Harm Poll surveyed 2085 U.S....Ch. 2 - Examine Figure 2-20, Everyone Agrees: Slobs Make...Ch. 2 - Examine Figure 2-21, Global Teen Worries. How many...Ch. 2 - In your own words, explain the differences among...Ch. 2 - What do we mean when we say a histogram is skewed...Ch. 2 - Discuss the statement that stem-and-leaf displays...Ch. 2 - The following tables show the first-round winning...Ch. 2 - The following tables show the first-round winning...Ch. 2 - The Following tables show the first-round winning...
Knowledge Booster


Learn more about
Need a deep-dive on the concept behind this application? Look no further. Learn more about this topic, statistics and related others by exploring similar questions and additional content below.Similar questions
- The details of the clock sales at a supermarket for the past 6 weeks are shown in the table below. The time series appears to be relatively stable, without trend, seasonal, or cyclical effects. The simple moving average value of k is set at 2. If the smoothing constant is assumed to be 0.7, and setting F1 and F2=A1, what is the exponential smoothing sales forecast for week 7? Round to the nearest whole number. Week Units sold 1 88 2 44 3 54 4 65 5 72 6 85 Question content area bottom Part 1 A. 80 clocks B. 60 clocks C. 70 clocks D. 50 clocksarrow_forwardThe details of the clock sales at a supermarket for the past 6 weeks are shown in the table below. The time series appears to be relatively stable, without trend, seasonal, or cyclical effects. The simple moving average value of k is set at 2. Calculate the value of the simple moving average mean absolute percentage error. Round to two decimal places. Week Units sold 1 88 2 44 3 54 4 65 5 72 6 85 Part 1 A. 14.39 B. 25.56 C. 23.45 D. 20.90arrow_forwardThe accompanying data shows the fossil fuels production, fossil fuels consumption, and total energy consumption in quadrillions of BTUs of a certain region for the years 1986 to 2015. Complete parts a and b. Year Fossil Fuels Production Fossil Fuels Consumption Total Energy Consumption1949 28.748 29.002 31.9821950 32.563 31.632 34.6161951 35.792 34.008 36.9741952 34.977 33.800 36.7481953 35.349 34.826 37.6641954 33.764 33.877 36.6391955 37.364 37.410 40.2081956 39.771 38.888 41.7541957 40.133 38.926 41.7871958 37.216 38.717 41.6451959 39.045 40.550 43.4661960 39.869 42.137 45.0861961 40.307 42.758 45.7381962 41.732 44.681 47.8261963 44.037 46.509 49.6441964 45.789 48.543 51.8151965 47.235 50.577 54.0151966 50.035 53.514 57.0141967 52.597 55.127 58.9051968 54.306 58.502 62.4151969 56.286…arrow_forward
- The accompanying data shows the fossil fuels production, fossil fuels consumption, and total energy consumption in quadrillions of BTUs of a certain region for the years 1986 to 2015. Complete parts a and b. Year Fossil Fuels Production Fossil Fuels Consumption Total Energy Consumption1949 28.748 29.002 31.9821950 32.563 31.632 34.6161951 35.792 34.008 36.9741952 34.977 33.800 36.7481953 35.349 34.826 37.6641954 33.764 33.877 36.6391955 37.364 37.410 40.2081956 39.771 38.888 41.7541957 40.133 38.926 41.7871958 37.216 38.717 41.6451959 39.045 40.550 43.4661960 39.869 42.137 45.0861961 40.307 42.758 45.7381962 41.732 44.681 47.8261963 44.037 46.509 49.6441964 45.789 48.543 51.8151965 47.235 50.577 54.0151966 50.035 53.514 57.0141967 52.597 55.127 58.9051968 54.306 58.502 62.4151969 56.286…arrow_forwardThe accompanying data shows the fossil fuels production, fossil fuels consumption, and total energy consumption in quadrillions of BTUs of a certain region for the years 1986 to 2015. Complete parts a and b. Develop line charts for each variable and identify the characteristics of the time series (that is, random, stationary, trend, seasonal, or cyclical). What is the line chart for the variable Fossil Fuels Production?arrow_forwardThe accompanying data shows the fossil fuels production, fossil fuels consumption, and total energy consumption in quadrillions of BTUs of a certain region for the years 1986 to 2015. Complete parts a and b. Year Fossil Fuels Production Fossil Fuels Consumption Total Energy Consumption1949 28.748 29.002 31.9821950 32.563 31.632 34.6161951 35.792 34.008 36.9741952 34.977 33.800 36.7481953 35.349 34.826 37.6641954 33.764 33.877 36.6391955 37.364 37.410 40.2081956 39.771 38.888 41.7541957 40.133 38.926 41.7871958 37.216 38.717 41.6451959 39.045 40.550 43.4661960 39.869 42.137 45.0861961 40.307 42.758 45.7381962 41.732 44.681 47.8261963 44.037 46.509 49.6441964 45.789 48.543 51.8151965 47.235 50.577 54.0151966 50.035 53.514 57.0141967 52.597 55.127 58.9051968 54.306 58.502 62.4151969 56.286…arrow_forward
- For each of the time series, construct a line chart of the data and identify the characteristics of the time series (that is, random, stationary, trend, seasonal, or cyclical). Month PercentApr 1972 4.97May 1972 5.00Jun 1972 5.04Jul 1972 5.25Aug 1972 5.27Sep 1972 5.50Oct 1972 5.73Nov 1972 5.75Dec 1972 5.79Jan 1973 6.00Feb 1973 6.02Mar 1973 6.30Apr 1973 6.61May 1973 7.01Jun 1973 7.49Jul 1973 8.30Aug 1973 9.23Sep 1973 9.86Oct 1973 9.94Nov 1973 9.75Dec 1973 9.75Jan 1974 9.73Feb 1974 9.21Mar 1974 8.85Apr 1974 10.02May 1974 11.25Jun 1974 11.54Jul 1974 11.97Aug 1974 12.00Sep 1974 12.00Oct 1974 11.68Nov 1974 10.83Dec 1974 10.50Jan 1975 10.05Feb 1975 8.96Mar 1975 7.93Apr 1975 7.50May 1975 7.40Jun 1975 7.07Jul 1975 7.15Aug 1975 7.66Sep 1975 7.88Oct 1975 7.96Nov 1975 7.53Dec 1975 7.26Jan 1976 7.00Feb 1976 6.75Mar 1976 6.75Apr 1976 6.75May 1976…arrow_forwardHi, I need to make sure I have drafted a thorough analysis, so please answer the following questions. Based on the data in the attached image, develop a regression model to forecast the average sales of football magazines for each of the seven home games in the upcoming season (Year 10). That is, you should construct a single regression model and use it to estimate the average demand for the seven home games in Year 10. In addition to the variables provided, you may create new variables based on these variables or based on observations of your analysis. Be sure to provide a thorough analysis of your final model (residual diagnostics) and provide assessments of its accuracy. What insights are available based on your regression model?arrow_forwardI want to make sure that I included all possible variables and observations. There is a considerable amount of data in the images below, but not all of it may be useful for your purposes. Are there variables contained in the file that you would exclude from a forecast model to determine football magazine sales in Year 10? If so, why? Are there particular observations of football magazine sales from previous years that you would exclude from your forecasting model? If so, why?arrow_forward
- Stat questionsarrow_forward1) and let Xt is stochastic process with WSS and Rxlt t+t) 1) E (X5) = \ 1 2 Show that E (X5 = X 3 = 2 (= = =) Since X is WSSEL 2 3) find E(X5+ X3)² 4) sind E(X5+X2) J=1 ***arrow_forwardProve that 1) | RxX (T) | << = (R₁ " + R$) 2) find Laplalse trans. of Normal dis: 3) Prove thy t /Rx (z) | < | Rx (0)\ 4) show that evary algebra is algebra or not.arrow_forward
arrow_back_ios
SEE MORE QUESTIONS
arrow_forward_ios
Recommended textbooks for you
 Big Ideas Math A Bridge To Success Algebra 1: Stu...AlgebraISBN:9781680331141Author:HOUGHTON MIFFLIN HARCOURTPublisher:Houghton Mifflin Harcourt
 Glencoe Algebra 1, Student Edition, 9780079039897...AlgebraISBN:9780079039897Author:CarterPublisher:McGraw Hill
 Holt Mcdougal Larson Pre-algebra: Student Edition...AlgebraISBN:9780547587776Author:HOLT MCDOUGALPublisher:HOLT MCDOUGAL
Big Ideas Math A Bridge To Success Algebra 1: Stu...
Algebra
ISBN:9781680331141
Author:HOUGHTON MIFFLIN HARCOURT
Publisher:Houghton Mifflin Harcourt
Glencoe Algebra 1, Student Edition, 9780079039897...
Algebra
ISBN:9780079039897
Author:Carter
Publisher:McGraw Hill
Holt Mcdougal Larson Pre-algebra: Student Edition...
Algebra
ISBN:9780547587776
Author:HOLT MCDOUGAL
Publisher:HOLT MCDOUGAL
Which is the best chart: Selecting among 14 types of charts Part II; Author: 365 Data Science;https://www.youtube.com/watch?v=qGaIB-bRn-A;License: Standard YouTube License, CC-BY