
Videos
Technology: Cars The following cluster bar graph shows responses from different age groups to questions regarding connectivity and tracking technology found in new cars. A recent Hams Poll asked respondents how much they agreed or disagreed with statements that they
(1)worry that the technologies cause too much distraction and are dangerous;
(2)worry about letting companies know too much about location and driving habits.
(3)worry that insurance rates could increase because of knowledge of driving habits;
(4)think the technologies make driving more enjoyable;
(5) feel safer with the technologies;
(6) feel it is important to stay connected when in vehicle.
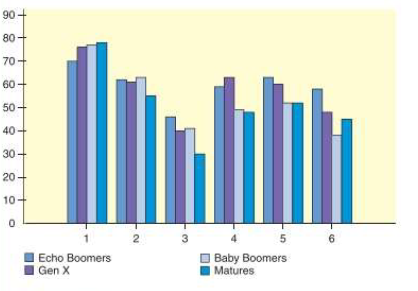
The graph shows the percentage of respondents in each age category who agree strongly or somewhat agree to each of the six statements.
(a) Interpretation Which statement has the highest rale of agreement for all four age groups?
(b) Interpretation Which age group expresses the least worry about insurance companies raising their rates because of the driving habit information collected by the technologies?
(c) Interpretation Which age group ha* the highest percentage of those who find the technologies make driving more enjoy able?

Trending nowThis is a popular solution!

Chapter 2 Solutions
Understanding Basic Statistics


- A marketing agency wants to determine whether different advertising platforms generate significantly different levels of customer engagement. The agency measures the average number of daily clicks on ads for three platforms: Social Media, Search Engines, and Email Campaigns. The agency collects data on daily clicks for each platform over a 10-day period and wants to test whether there is a statistically significant difference in the mean number of daily clicks among these platforms. Conduct ANOVA test. You can provide your answer by inserting a text box and the answer must include: also please provide a step by on getting the answers in excel Null hypothesis, Alternative hypothesis, Show answer (output table/summary table), and Conclusion based on the P value.arrow_forwardA company found that the daily sales revenue of its flagship product follows a normal distribution with a mean of $4500 and a standard deviation of $450. The company defines a "high-sales day" that is, any day with sales exceeding $4800. please provide a step by step on how to get the answers Q: What percentage of days can the company expect to have "high-sales days" or sales greater than $4800? Q: What is the sales revenue threshold for the bottom 10% of days? (please note that 10% refers to the probability/area under bell curve towards the lower tail of bell curve) Provide answers in the yellow cellsarrow_forwardBusiness Discussarrow_forward
- The following data represent total ventilation measured in liters of air per minute per square meter of body area for two independent (and randomly chosen) samples. Analyze these data using the appropriate non-parametric hypothesis testarrow_forwardeach column represents before & after measurements on the same individual. Analyze with the appropriate non-parametric hypothesis test for a paired design.arrow_forwardShould you be confident in applying your regression equation to estimate the heart rate of a python at 35°C? Why or why not?arrow_forward
 Big Ideas Math A Bridge To Success Algebra 1: Stu...AlgebraISBN:9781680331141Author:HOUGHTON MIFFLIN HARCOURTPublisher:Houghton Mifflin Harcourt
 Glencoe Algebra 1, Student Edition, 9780079039897...AlgebraISBN:9780079039897Author:CarterPublisher:McGraw Hill