
Fundamentals of Statistics (5th Edition)
5th Edition
ISBN: 9780134508306
Author: Michael Sullivan III
Publisher: PEARSON
expand_more
expand_more
format_list_bulleted
Concept explainers
Videos
Textbook Question
Chapter 2.2, Problem 10AYU
Car Sales A car salesman records the number of cars he sold each week for the past year. The following frequency histogram shows the results.
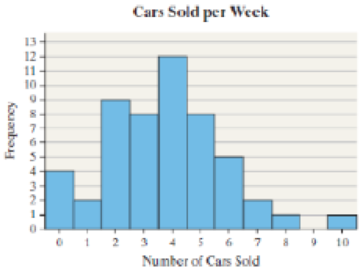
- a. What is the most frequent number of cars sold in a week?
- b. For how many weeks were two cars sold?
- c. Determine the percentage of time two cars were sold.
- d. Describe the shape of the distribution.
Expert Solution & Answer

Trending nowThis is a popular solution!

Students have asked these similar questions
Business
3. Bayesian Inference – Updating Beliefs
A medical test for a rare disease has the following characteristics:
Sensitivity (true positive rate): 99%
Specificity (true negative rate): 98%
The disease occurs in 0.5% of the population.
A patient receives a positive test result.
Questions:
a) Define the relevant events and use Bayes’ Theorem to compute the probability that the patient actually has the disease.b) Explain why the result might seem counterintuitive, despite the high sensitivity and specificity.c) Discuss how prior probabilities influence posterior beliefs in Bayesian inference.d) Suppose a second, independent test with the same accuracy is conducted and is also positive. Update the probability that the patient has the disease.
4. Linear Regression - Model Assumptions and Interpretation
A real estate analyst is studying how house prices (Y) are related to house size in square feet (X). A simple
linear regression model is proposed:
The analyst fits the model and obtains:
•
Ŷ50,000+150X
YBoB₁X + €
•
R² = 0.76
• Residuals show a fan-shaped pattern when plotted against fitted values.
Questions:
a) Interpret the slope coefficient in context.
b) Explain what the R² value tells us about the model's performance.
c) Based on the residual pattern, what regression assumption is likely violated? What might be the
consequence?
d) Suggest at least two remedies to improve the model, based on the residual analysis.
Chapter 2 Solutions
Fundamentals of Statistics (5th Edition)
Ch. 2.1 - Define raw data in your own words.Ch. 2.1 - A frequency distribution lists the _____ of...Ch. 2.1 - In a relative frequency distribution, what should...Ch. 2.1 - What is a bar graph? What is a Pareto chart?Ch. 2.1 - Flu Season The pie chart shown, the type we see in...Ch. 2.1 - Cosmetic Surgery This USA Today type chart shows...Ch. 2.1 - Most Valuable Player The following Pareto chart...Ch. 2.1 - Poverty The U.S. Census Bureau uses money income...Ch. 2.1 - Divorce The following graph represents the results...Ch. 2.1 - Identity Theft Identity fraud occurs when someone...
Ch. 2.1 - Made in America A random sample of 2163 adults...Ch. 2.1 - Desirability Attributes A random sample of 2163...Ch. 2.1 - College Survey In a national survey conducted by...Ch. 2.1 - College Survey In a national survey conducted by...Ch. 2.1 - Use the Internet? The Gallup organization...Ch. 2.1 - Dining Out A sample of 521 adults was asked, How...Ch. 2.1 - NW Texting A survey of U.S. adults and teens (ages...Ch. 2.1 - Educational Attainment The educational attainment...Ch. 2.1 - Dream Job A survey of adult men and women asked,...Ch. 2.1 - Car Color A survey of 100 randomly selected autos...Ch. 2.1 - Prob. 21AYUCh. 2.1 - Bachelor Party In a survey conducted by Opinion...Ch. 2.1 - Favorite Day to Eat Out A survey was conducted by...Ch. 2.1 - Prob. 25AYUCh. 2.1 - Prob. 26AYUCh. 2.1 - Prob. 27AYUCh. 2.1 - StatCrunch Survey Choose a qualitative variable...Ch. 2.1 - Putting It Together: Online Homework Keeping...Ch. 2.1 - When should relative frequencies be used when...Ch. 2.1 - Prob. 31AYUCh. 2.1 - Prob. 32AYUCh. 2.1 - Prob. 33AYUCh. 2.2 - The categories by which data are grouped are...Ch. 2.2 - The _____ class limit is the smallest value within...Ch. 2.2 - The _____ is the difference between consecutive...Ch. 2.2 - Prob. 4AYUCh. 2.2 - Prob. 5AYUCh. 2.2 - Prob. 6AYUCh. 2.2 - True or False: The shape of the distribution shown...Ch. 2.2 - Prob. 8AYUCh. 2.2 - Rolling the Dice An experiment was conducted in...Ch. 2.2 - Car Sales A car salesman records the number of...Ch. 2.2 - IQ Scores The following frequency histogram...Ch. 2.2 - Alcohol-Related Traffic Fatalities The frequency...Ch. 2.2 - In Problems 13 and 14, for each variable...Ch. 2.2 - In Problems 13 and 14, for each variable...Ch. 2.2 - Misery Index The following time-series plot shows...Ch. 2.2 - Prob. 16AYUCh. 2.2 - Predicting School Enrollment To predict future...Ch. 2.2 - Free Throws In an experiment, a researcher asks a...Ch. 2.2 - In Problems 1922, determine the original set of...Ch. 2.2 - In Problems 1922, determine the original set of...Ch. 2.2 - In Problems 1922, determine the original set of...Ch. 2.2 - In Problems 1922, determine the original set of...Ch. 2.2 - find (a) the number of classes, (b) the class...Ch. 2.2 - Earthquakes The following data represent the...Ch. 2.2 - In Problems 25 and 26, construct (a) a relative...Ch. 2.2 - In Problems 25 and 26, construct (a) a relative...Ch. 2.2 - NW Televisions in the Household A researcher with...Ch. 2.2 - Waiting The data below represent the number of...Ch. 2.2 - NW Gini Index The Gini Index is a measure of how...Ch. 2.2 - Average Income The following data represent the...Ch. 2.2 - Cigarette Tex Rates The table shows the tax, in...Ch. 2.2 - Dividend Yield A dividend is a payment from a...Ch. 2.2 - NW Violent Crimes Violent crimes include murder,...Ch. 2.2 - Volume of Altria Group Stock The volume of a stock...Ch. 2.2 - Prob. 35AYUCh. 2.2 - Prob. 36AYUCh. 2.2 - Prob. 37AYUCh. 2.2 - Prob. 38AYUCh. 2.2 - Prob. 39AYUCh. 2.2 - Prob. 40AYUCh. 2.2 - NW Violent Crimes Use the violent crime rate data...Ch. 2.2 - Academy Award Winners The following data represent...Ch. 2.2 - Prob. 43AYUCh. 2.2 - Sullivan Survey Choose a continuous quantitative...Ch. 2.2 - Prob. 46AYUCh. 2.2 - Prob. 47AYUCh. 2.2 - Waiting Draw a dot plot of the waiting data from...Ch. 2.2 - Prob. 49AYUCh. 2.2 - Prob. 50AYUCh. 2.2 - Prob. 51AYUCh. 2.2 - Prob. 52AYUCh. 2.2 - Prob. 53AYUCh. 2.2 - Putting It Together: Which Graphical Summary?...Ch. 2.2 - Prob. 55AYUCh. 2.2 - Prob. 56AYUCh. 2.2 - Discuss the advantages and disadvantages of...Ch. 2.2 - Prob. 58AYUCh. 2.2 - Describe the situations in which it is preferable...Ch. 2.2 - Sketch four histogramsone skewed right, one skewed...Ch. 2.2 - What type of variable is required when drawing...Ch. 2.3 - Inauguration Cost The following is a USA...Ch. 2.3 - Burning Calories The following is a USA Today-type...Ch. 2.3 - NW Median Earnings The graph shows the median...Ch. 2.3 - Union Membership The following relative frequency...Ch. 2.3 - NW Robberies A newspaper article claimed that the...Ch. 2.3 - Car Accidents An article in a student newspaper...Ch. 2.3 - Tax Revenue The following histogram drawn in...Ch. 2.3 - You Explain It! Oil Reserves The U.S. Strategic...Ch. 2.3 - NW Cost of Kids The following is a USA Today-type...Ch. 2.3 - Worker Injury The safety manager at Klutz...Ch. 2.3 - Health Care Expenditures The following data...Ch. 2.3 - Prob. 12AYUCh. 2.3 - NW Overweight Between 1980 and 2012, the number of...Ch. 2.3 - Ideal Family Size The following USA Today-type...Ch. 2.3 - National League Baseball MVP The following pie...Ch. 2.3 - Prob. 16AYUCh. 2 - Effective Commercial Harris Interactive conducted...Ch. 2 - Weapons Used in Homicide The following frequency...Ch. 2 - Live Births The following frequency distribution...Ch. 2 - Political Affiliation One hundred randomly...Ch. 2 - Family Size A random sample of 60 couples married...Ch. 2 - Home Ownership Rates The table shows the home...Ch. 2 - Diameter of a Cookie The following data represent...Ch. 2 - Time Online The following data represent the...Ch. 2 - Grade Inflation The side-by-side bar graph to the...Ch. 2 - Income Distribution The following data represent...Ch. 2 - Misleading Graphs In 2013, the average earnings of...Ch. 2 - High Heels The graphic to the right is a USA Today...Ch. 2 - The graph shows the ratings on Yelp for Hot Dougs...Ch. 2 - A random sample of 1005 adult Americans was asked,...Ch. 2 - Interested in knowing the educational background...Ch. 2 - The following data represent the number of cars...Ch. 2 - Dr. Paul Oswiecmiski randomly selects 40 of his...Ch. 2 - The following data represent the time (in minutes)...Ch. 2 - The data below shows birth rate and per capita...Ch. 2 - The following is a USA Today-type graph. Do you...Ch. 2 - A bar graph or pie chart (or both) that depicts...Ch. 2 - A histogram that displays the distribution of...Ch. 2 - Six histograms displaying tornado duration for...Ch. 2 - A bar chart that shows the relationship between...Ch. 2 - A bar chart that shows the relationship between...Ch. 2 - A general summary of your findings and...
Knowledge Booster


Learn more about
Need a deep-dive on the concept behind this application? Look no further. Learn more about this topic, statistics and related others by exploring similar questions and additional content below.Similar questions
- 5. Probability Distributions – Continuous Random Variables A factory machine produces metal rods whose lengths (in cm) follow a continuous uniform distribution on the interval [98, 102]. Questions: a) Define the probability density function (PDF) of the rod length.b) Calculate the probability that a randomly selected rod is shorter than 99 cm.c) Determine the expected value and variance of rod lengths.d) If a sample of 25 rods is selected, what is the probability that their average length is between 99.5 cm and 100.5 cm? Justify your answer using the appropriate distribution.arrow_forward2. Hypothesis Testing - Two Sample Means A nutritionist is investigating the effect of two different diet programs, A and B, on weight loss. Two independent samples of adults were randomly assigned to each diet for 12 weeks. The weight losses (in kg) are normally distributed. Sample A: n = 35, 4.8, s = 1.2 Sample B: n=40, 4.3, 8 = 1.0 Questions: a) State the null and alternative hypotheses to test whether there is a significant difference in mean weight loss between the two diet programs. b) Perform a hypothesis test at the 5% significance level and interpret the result. c) Compute a 95% confidence interval for the difference in means and interpret it. d) Discuss assumptions of this test and explain how violations of these assumptions could impact the results.arrow_forward1. Sampling Distribution and the Central Limit Theorem A company produces batteries with a mean lifetime of 300 hours and a standard deviation of 50 hours. The lifetimes are not normally distributed—they are right-skewed due to some batteries lasting unusually long. Suppose a quality control analyst selects a random sample of 64 batteries from a large production batch. Questions: a) Explain whether the distribution of sample means will be approximately normal. Justify your answer using the Central Limit Theorem. b) Compute the mean and standard deviation of the sampling distribution of the sample mean. c) What is the probability that the sample mean lifetime of the 64 batteries exceeds 310 hours? d) Discuss how the sample size affects the shape and variability of the sampling distribution.arrow_forward
- A biologist is investigating the effect of potential plant hormones by treating 20 stem segments. At the end of the observation period he computes the following length averages: Compound X = 1.18 Compound Y = 1.17 Based on these mean values he concludes that there are no treatment differences. 1) Are you satisfied with his conclusion? Why or why not? 2) If he asked you for help in analyzing these data, what statistical method would you suggest that he use to come to a meaningful conclusion about his data and why? 3) Are there any other questions you would ask him regarding his experiment, data collection, and analysis methods?arrow_forwardBusinessarrow_forwardWhat is the solution and answer to question?arrow_forward
- To: [Boss's Name] From: Nathaniel D Sain Date: 4/5/2025 Subject: Decision Analysis for Business Scenario Introduction to the Business Scenario Our delivery services business has been experiencing steady growth, leading to an increased demand for faster and more efficient deliveries. To meet this demand, we must decide on the best strategy to expand our fleet. The three possible alternatives under consideration are purchasing new delivery vehicles, leasing vehicles, or partnering with third-party drivers. The decision must account for various external factors, including fuel price fluctuations, demand stability, and competition growth, which we categorize as the states of nature. Each alternative presents unique advantages and challenges, and our goal is to select the most viable option using a structured decision-making approach. Alternatives and States of Nature The three alternatives for fleet expansion were chosen based on their cost implications, operational efficiency, and…arrow_forwardBusinessarrow_forwardWhy researchers are interested in describing measures of the center and measures of variation of a data set?arrow_forward
- WHAT IS THE SOLUTION?arrow_forwardThe following ordered data list shows the data speeds for cell phones used by a telephone company at an airport: A. Calculate the Measures of Central Tendency from the ungrouped data list. B. Group the data in an appropriate frequency table. C. Calculate the Measures of Central Tendency using the table in point B. 0.8 1.4 1.8 1.9 3.2 3.6 4.5 4.5 4.6 6.2 6.5 7.7 7.9 9.9 10.2 10.3 10.9 11.1 11.1 11.6 11.8 12.0 13.1 13.5 13.7 14.1 14.2 14.7 15.0 15.1 15.5 15.8 16.0 17.5 18.2 20.2 21.1 21.5 22.2 22.4 23.1 24.5 25.7 28.5 34.6 38.5 43.0 55.6 71.3 77.8arrow_forwardII Consider the following data matrix X: X1 X2 0.5 0.4 0.2 0.5 0.5 0.5 10.3 10 10.1 10.4 10.1 10.5 What will the resulting clusters be when using the k-Means method with k = 2. In your own words, explain why this result is indeed expected, i.e. why this clustering minimises the ESS map.arrow_forward
arrow_back_ios
SEE MORE QUESTIONS
arrow_forward_ios
Recommended textbooks for you
 Holt Mcdougal Larson Pre-algebra: Student Edition...AlgebraISBN:9780547587776Author:HOLT MCDOUGALPublisher:HOLT MCDOUGAL
 Big Ideas Math A Bridge To Success Algebra 1: Stu...AlgebraISBN:9781680331141Author:HOUGHTON MIFFLIN HARCOURTPublisher:Houghton Mifflin Harcourt
 Glencoe Algebra 1, Student Edition, 9780079039897...AlgebraISBN:9780079039897Author:CarterPublisher:McGraw Hill
 Functions and Change: A Modeling Approach to Coll...AlgebraISBN:9781337111348Author:Bruce Crauder, Benny Evans, Alan NoellPublisher:Cengage Learning
 College Algebra (MindTap Course List)AlgebraISBN:9781305652231Author:R. David Gustafson, Jeff HughesPublisher:Cengage Learning
Holt Mcdougal Larson Pre-algebra: Student Edition...
Algebra
ISBN:9780547587776
Author:HOLT MCDOUGAL
Publisher:HOLT MCDOUGAL
Big Ideas Math A Bridge To Success Algebra 1: Stu...
Algebra
ISBN:9781680331141
Author:HOUGHTON MIFFLIN HARCOURT
Publisher:Houghton Mifflin Harcourt
Glencoe Algebra 1, Student Edition, 9780079039897...
Algebra
ISBN:9780079039897
Author:Carter
Publisher:McGraw Hill
Functions and Change: A Modeling Approach to Coll...
Algebra
ISBN:9781337111348
Author:Bruce Crauder, Benny Evans, Alan Noell
Publisher:Cengage Learning
College Algebra (MindTap Course List)
Algebra
ISBN:9781305652231
Author:R. David Gustafson, Jeff Hughes
Publisher:Cengage Learning
Area Between The Curve Problem No 1 - Applications Of Definite Integration - Diploma Maths II; Author: Ekeeda;https://www.youtube.com/watch?v=q3ZU0GnGaxA;License: Standard YouTube License, CC-BY