
(a.)
To sketch: a graph of elevation
(a.)
Answer to Problem 30E
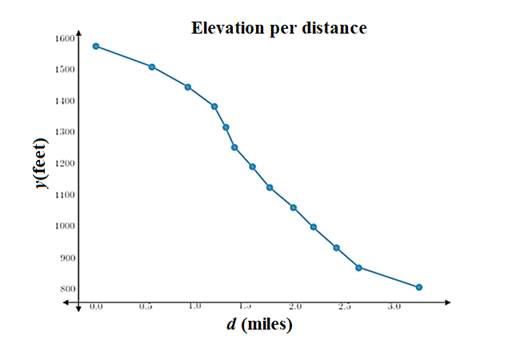
The required graph is shown.
Explanation of Solution
Given:
| Elevation Along Bear Creek | |
| Distance Downriver | River Elevation |
| 0.00 | 1577 |
| 0.56 | 1512 |
| 0.92 | 1448 |
| 1.19 | 1384 |
| 1.30 | 1319 |
| 1.39 | 1255 |
| 1.57 | 1191 |
| 1.74 | 1126 |
| 1.98 | 1062 |
| 2.18 | 998 |
| 2.41 | 933 |
| 2.64 | 869 |
| 3.24 | 805 |
Calculation:
Plot the points on graph and join them

(b.)
To obtain: an approximate graph of the derivative.
(b.)
Answer to Problem 30E
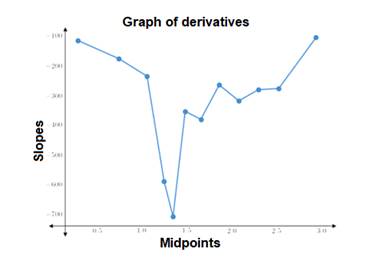
The graph of the derivative is shown.
Explanation of Solution
Given:
| Elevation Along Bear Creek | |
| Distance Downriver | River Elevation |
| 0.00 | 1577 |
| 0.56 | 1512 |
| 0.92 | 1448 |
| 1.19 | 1384 |
| 1.30 | 1319 |
| 1.39 | 1255 |
| 1.57 | 1191 |
| 1.74 | 1126 |
| 1.98 | 1062 |
| 2.18 | 998 |
| 2.41 | 933 |
| 2.64 | 869 |
| 3.24 | 805 |
Concept used:
The derivative of a function is represented by slope of graph.
Calculation:
Create a table with mid point of each interval and their respective slopes.
| Elevation Along Bear Creek | |
| Distance Downriver | River Elevation |
Now plot the above points on the graph and join them.

(c.)
The units of measure would be appropriate for a gradient in this problem.
(c.)
Answer to Problem 30E
The unit of gradient is feet per mile.
Explanation of Solution
Given:
| Elevation Along Bear Creek | |
| Distance Downriver (miles) | River Elevation (feet) |
| 0.00 | 1577 |
| 0.56 | 1512 |
| 0.92 | 1448 |
| 1.19 | 1384 |
| 1.30 | 1319 |
| 1.39 | 1255 |
| 1.57 | 1191 |
| 1.74 | 1126 |
| 1.98 | 1062 |
| 2.18 | 998 |
| 2.41 | 933 |
| 2.64 | 869 |
| 3.24 | 805 |
Concept used:
The average change in elevation over a given distance is called a gradient.
Conclusion:
Here, the elevation is given in feet and the distance down the river is given in miles.
Thus, the units of the gradient will be feet per mile.
(d.)
The units of measure would be appropriate for derivative.
(d.)
Answer to Problem 30E
The units of the gradient will be feet per mile.
Explanation of Solution
Given:
| Elevation Along Bear Creek | |
| Distance Downriver (miles) | River Elevation (feet) |
| 0.00 | 1577 |
| 0.56 | 1512 |
| 0.92 | 1448 |
| 1.19 | 1384 |
| 1.30 | 1319 |
| 1.39 | 1255 |
| 1.57 | 1191 |
| 1.74 | 1126 |
| 1.98 | 1062 |
| 2.18 | 998 |
| 2.41 | 933 |
| 2.64 | 869 |
| 3.24 | 805 |
Concept used:
Derivative is given by the slope.
Here, the average change in elevation over a given distance is slope.
Conclusion:
Here, the elevation is given in feet and the distance down the river is given in miles.
Thus, the units of the gradient will be feet per mile.
(e)
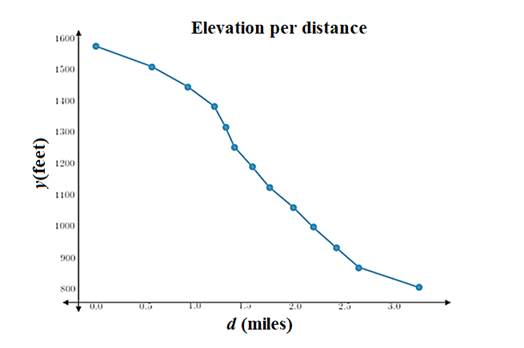
To identify: The most dangerous section of the river by analyzing the graph in (a).
(e)
Answer to Problem 30E
The most dangerous section of the river is from 1.2 to 1.5 miles.
Explanation of Solution
Given:
| Elevation Along Bear Creek | |
| Distance Downriver (miles) | River Elevation (feet) |
| 0.00 | 1577 |
| 0.56 | 1512 |
| 0.92 | 1448 |
| 1.19 | 1384 |
| 1.30 | 1319 |
| 1.39 | 1255 |
| 1.57 | 1191 |
| 1.74 | 1126 |
| 1.98 | 1062 |
| 2.18 | 998 |
| 2.41 | 933 |
| 2.64 | 869 |
| 3.24 | 805 |
Conclusion:
In the graph, the steepest part which is from 1.2 to 1.5 miles.
Chapter 2 Solutions
Advanced Placement Calculus Graphical Numerical Algebraic Sixth Edition High School Binding Copyright 2020

- For the system consisting of the lines: and 71 = (-8,5,6) + t(4, −5,3) 72 = (0, −24,9) + u(−1, 6, −3) a) State whether the two lines are parallel or not and justify your answer. b) Find the point of intersection, if possible, and classify the system based on the number of points of intersection and how the lines are related. Show a complete solution process.arrow_forward3. [-/2 Points] DETAILS MY NOTES SESSCALCET2 7.4.013. Find the exact length of the curve. y = In(sec x), 0 ≤ x ≤ π/4arrow_forwardH.w WI M Wz A Sindax Sind dy max Утах at 0.75m from A w=6KN/M L=2 W2=9 KN/m P= 10 KN B Make the solution handwritten and not artificial intelligence because I will give a bad rating if you solve it with artificial intelligencearrow_forward
- Solve by DrWz WI P L B dy Sind Ⓡ de max ⑦Ymax dx Solve by Dr ③Yat 0.75m from A w=6KN/M L=2 W2=9 kN/m P= 10 KN Solve By Drarrow_forwardHow to find the radius of convergence for the series in the image below? I'm stuck on how to isolate the x in the interval of convergence.arrow_forwardDetermine the exact signed area between the curve g(x): x-axis on the interval [0,1]. = tan2/5 secx dx andarrow_forward
 Calculus: Early TranscendentalsCalculusISBN:9781285741550Author:James StewartPublisher:Cengage Learning
 Thomas' Calculus (14th Edition)CalculusISBN:9780134438986Author:Joel R. Hass, Christopher E. Heil, Maurice D. WeirPublisher:PEARSON
 Calculus: Early Transcendentals (3rd Edition)CalculusISBN:9780134763644Author:William L. Briggs, Lyle Cochran, Bernard Gillett, Eric SchulzPublisher:PEARSON
 Calculus: Early TranscendentalsCalculusISBN:9781319050740Author:Jon Rogawski, Colin Adams, Robert FranzosaPublisher:W. H. Freeman
 Calculus: Early Transcendental FunctionsCalculusISBN:9781337552516Author:Ron Larson, Bruce H. EdwardsPublisher:Cengage Learning