
Statistics Through Applications
2nd Edition
ISBN: 9781429219747
Author: Daren S. Starnes, David Moore, Dan Yates
Publisher: Macmillan Higher Education
expand_more
expand_more
format_list_bulleted
Videos
Question
Chapter 2.1, Problem 2.1E
(a)
To determine
To Calculate: the women not married in 2007.
(a)
Expert Solution
Answer to Problem 2.1E
49679000
Explanation of Solution
Given:
Married in 2007 = 65128
Total marital status in 2007 = 114807
Calculation:
Number of women not married in 2007= Total marital status in 2007 - married in 2007
=114807000-65128000
=49679000
(b)
To determine
To construct: the bar graph on the basis of given data.
(b)
Expert Solution
Explanation of Solution
Given:
| Marital Status | Count |
| Never married | 25262 |
| Married | 65128 |
| Widowed | 11208 |
| Divorced | 13210 |
Graph:
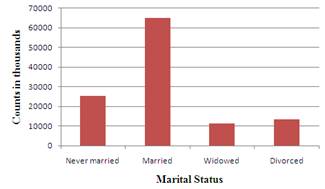
The bar graph is showing that married bar is too much higher than other bars it means that married person is more than other aspects and the lowest bar is of widowed which is looking forth.
Chapter 2 Solutions
Statistics Through Applications
Ch. 2.1 - Prob. 2.1ECh. 2.1 - Prob. 2.2ECh. 2.1 - Prob. 2.3ECh. 2.1 - Prob. 2.4ECh. 2.1 - Prob. 2.5ECh. 2.1 - Prob. 2.6ECh. 2.1 - Prob. 2.7ECh. 2.1 - Prob. 2.8ECh. 2.1 - Prob. 2.9ECh. 2.1 - Prob. 2.10E
Ch. 2.1 - Prob. 2.11ECh. 2.1 - Prob. 2.12ECh. 2.1 - Prob. 2.13ECh. 2.1 - Prob. 2.14ECh. 2.1 - Prob. 2.15ECh. 2.1 - Prob. 2.16ECh. 2.1 - Prob. 2.17ECh. 2.1 - Prob. 2.19ECh. 2.1 - Prob. 2.20ECh. 2.1 - Prob. 2.21ECh. 2.1 - Prob. 2.23ECh. 2.1 - Prob. 2.24ECh. 2.1 - Prob. 2.25ECh. 2.1 - Prob. 2.26ECh. 2.2 - Prob. 2.27ECh. 2.2 - Prob. 2.28ECh. 2.2 - Prob. 2.29ECh. 2.2 - Prob. 2.30ECh. 2.2 - Prob. 2.31ECh. 2.2 - Prob. 2.32ECh. 2.2 - Prob. 2.33ECh. 2.2 - Prob. 2.34ECh. 2.2 - Prob. 2.35ECh. 2.2 - Prob. 2.36ECh. 2.2 - Prob. 2.37ECh. 2.2 - Prob. 2.38ECh. 2.2 - Prob. 2.39ECh. 2.2 - Prob. 2.40ECh. 2.2 - Prob. 2.41ECh. 2.2 - Prob. 2.42ECh. 2.2 - Prob. 2.43ECh. 2.2 - Prob. 2.44ECh. 2.2 - Prob. 2.45ECh. 2.2 - Prob. 2.46ECh. 2.2 - Prob. 2.47ECh. 2.2 - Prob. 2.48ECh. 2.2 - Prob. 2.49ECh. 2.2 - Prob. 2.50ECh. 2.2 - Prob. 2.51ECh. 2.2 - Prob. 2.52ECh. 2.3 - Prob. 2.53ECh. 2.3 - Prob. 2.54ECh. 2.3 - Prob. 2.55ECh. 2.3 - Prob. 2.56ECh. 2.3 - Prob. 2.57ECh. 2.3 - Prob. 2.58ECh. 2.3 - Prob. 2.59ECh. 2.3 - Prob. 2.60ECh. 2.3 - Prob. 2.61ECh. 2.3 - Prob. 2.62ECh. 2.3 - Prob. 2.63ECh. 2.3 - Prob. 2.64ECh. 2.3 - Prob. 2.65ECh. 2 - Prob. 2.67RECh. 2 - Prob. 2.68RECh. 2 - Prob. 2.69RECh. 2 - Prob. 2.70RECh. 2 - Prob. 2.71RECh. 2 - Prob. 2.72RECh. 2 - Prob. 2.73RECh. 2 - Prob. 2.74RECh. 2 - Prob. 2.75RECh. 2 - Prob. 2.76RE
Additional Math Textbook Solutions
Find more solutions based on key concepts
the period of pendulum.
Pre-Algebra Student Edition
CHECK POINT I Let p and q represent the following statements: p : 3 + 5 = 8 q : 2 × 7 = 20. Determine the truth...
Thinking Mathematically (6th Edition)
Identifying Binomial Distributions. In Exercises 5–12, determine whether the given procedure results in a binom...
Elementary Statistics (13th Edition)
A pair of fair dice is rolled. What is the probability that the second die lands on a higher value than does th...
A First Course in Probability (10th Edition)
For a population containing N=902 individual, what code number would you assign for a. the first person on the ...
Basic Business Statistics, Student Value Edition
Knowledge Booster


Learn more about
Need a deep-dive on the concept behind this application? Look no further. Learn more about this topic, statistics and related others by exploring similar questions and additional content below.Similar questions
- 0|0|0|0 - Consider the time series X₁ and Y₁ = (I – B)² (I – B³)Xt. What transformations were performed on Xt to obtain Yt? seasonal difference of order 2 simple difference of order 5 seasonal difference of order 1 seasonal difference of order 5 simple difference of order 2arrow_forwardCalculate the 90% confidence interval for the population mean difference using the data in the attached image. I need to see where I went wrong.arrow_forwardMicrosoft Excel snapshot for random sampling: Also note the formula used for the last column 02 x✓ fx =INDEX(5852:58551, RANK(C2, $C$2:$C$51)) A B 1 No. States 2 1 ALABAMA Rand No. 0.925957526 3 2 ALASKA 0.372999976 4 3 ARIZONA 0.941323044 5 4 ARKANSAS 0.071266381 Random Sample CALIFORNIA NORTH CAROLINA ARKANSAS WASHINGTON G7 Microsoft Excel snapshot for systematic sampling: xfx INDEX(SD52:50551, F7) A B E F G 1 No. States Rand No. Random Sample population 50 2 1 ALABAMA 0.5296685 NEW HAMPSHIRE sample 10 3 2 ALASKA 0.4493186 OKLAHOMA k 5 4 3 ARIZONA 0.707914 KANSAS 5 4 ARKANSAS 0.4831379 NORTH DAKOTA 6 5 CALIFORNIA 0.7277162 INDIANA Random Sample Sample Name 7 6 COLORADO 0.5865002 MISSISSIPPI 8 7:ONNECTICU 0.7640596 ILLINOIS 9 8 DELAWARE 0.5783029 MISSOURI 525 10 15 INDIANA MARYLAND COLORADOarrow_forward
- Suppose the Internal Revenue Service reported that the mean tax refund for the year 2022 was $3401. Assume the standard deviation is $82.5 and that the amounts refunded follow a normal probability distribution. Solve the following three parts? (For the answer to question 14, 15, and 16, start with making a bell curve. Identify on the bell curve where is mean, X, and area(s) to be determined. 1.What percent of the refunds are more than $3,500? 2. What percent of the refunds are more than $3500 but less than $3579? 3. What percent of the refunds are more than $3325 but less than $3579?arrow_forwardA normal distribution has a mean of 50 and a standard deviation of 4. Solve the following three parts? 1. Compute the probability of a value between 44.0 and 55.0. (The question requires finding probability value between 44 and 55. Solve it in 3 steps. In the first step, use the above formula and x = 44, calculate probability value. In the second step repeat the first step with the only difference that x=55. In the third step, subtract the answer of the first part from the answer of the second part.) 2. Compute the probability of a value greater than 55.0. Use the same formula, x=55 and subtract the answer from 1. 3. Compute the probability of a value between 52.0 and 55.0. (The question requires finding probability value between 52 and 55. Solve it in 3 steps. In the first step, use the above formula and x = 52, calculate probability value. In the second step repeat the first step with the only difference that x=55. In the third step, subtract the answer of the first part from the…arrow_forwardIf a uniform distribution is defined over the interval from 6 to 10, then answer the followings: What is the mean of this uniform distribution? Show that the probability of any value between 6 and 10 is equal to 1.0 Find the probability of a value more than 7. Find the probability of a value between 7 and 9. The closing price of Schnur Sporting Goods Inc. common stock is uniformly distributed between $20 and $30 per share. What is the probability that the stock price will be: More than $27? Less than or equal to $24? The April rainfall in Flagstaff, Arizona, follows a uniform distribution between 0.5 and 3.00 inches. What is the mean amount of rainfall for the month? What is the probability of less than an inch of rain for the month? What is the probability of exactly 1.00 inch of rain? What is the probability of more than 1.50 inches of rain for the month? The best way to solve this problem is begin by a step by step creating a chart. Clearly mark the range, identifying the…arrow_forward
- Client 1 Weight before diet (pounds) Weight after diet (pounds) 128 120 2 131 123 3 140 141 4 178 170 5 121 118 6 136 136 7 118 121 8 136 127arrow_forwardClient 1 Weight before diet (pounds) Weight after diet (pounds) 128 120 2 131 123 3 140 141 4 178 170 5 121 118 6 136 136 7 118 121 8 136 127 a) Determine the mean change in patient weight from before to after the diet (after – before). What is the 95% confidence interval of this mean difference?arrow_forwardIn order to find probability, you can use this formula in Microsoft Excel: The best way to understand and solve these problems is by first drawing a bell curve and marking key points such as x, the mean, and the areas of interest. Once marked on the bell curve, figure out what calculations are needed to find the area of interest. =NORM.DIST(x, Mean, Standard Dev., TRUE). When the question mentions “greater than” you may have to subtract your answer from 1. When the question mentions “between (two values)”, you need to do separate calculation for both values and then subtract their results to get the answer. 1. Compute the probability of a value between 44.0 and 55.0. (The question requires finding probability value between 44 and 55. Solve it in 3 steps. In the first step, use the above formula and x = 44, calculate probability value. In the second step repeat the first step with the only difference that x=55. In the third step, subtract the answer of the first part from the…arrow_forward
- If a uniform distribution is defined over the interval from 6 to 10, then answer the followings: What is the mean of this uniform distribution? Show that the probability of any value between 6 and 10 is equal to 1.0 Find the probability of a value more than 7. Find the probability of a value between 7 and 9. The closing price of Schnur Sporting Goods Inc. common stock is uniformly distributed between $20 and $30 per share. What is the probability that the stock price will be: More than $27? Less than or equal to $24? The April rainfall in Flagstaff, Arizona, follows a uniform distribution between 0.5 and 3.00 inches. What is the mean amount of rainfall for the month? What is the probability of less than an inch of rain for the month? What is the probability of exactly 1.00 inch of rain? What is the probability of more than 1.50 inches of rain for the month? The best way to solve this problem is begin by creating a chart. Clearly mark the range, identifying the lower and upper…arrow_forwardProblem 1: The mean hourly pay of an American Airlines flight attendant is normally distributed with a mean of 40 per hour and a standard deviation of 3.00 per hour. What is the probability that the hourly pay of a randomly selected flight attendant is: Between the mean and $45 per hour? More than $45 per hour? Less than $32 per hour? Problem 2: The mean of a normal probability distribution is 400 pounds. The standard deviation is 10 pounds. What is the area between 415 pounds and the mean of 400 pounds? What is the area between the mean and 395 pounds? What is the probability of randomly selecting a value less than 395 pounds? Problem 3: In New York State, the mean salary for high school teachers in 2022 was 81,410 with a standard deviation of 9,500. Only Alaska’s mean salary was higher. Assume New York’s state salaries follow a normal distribution. What percent of New York State high school teachers earn between 70,000 and 75,000? What percent of New York State high school…arrow_forwardPls help asaparrow_forward
arrow_back_ios
SEE MORE QUESTIONS
arrow_forward_ios
Recommended textbooks for you
 MATLAB: An Introduction with ApplicationsStatisticsISBN:9781119256830Author:Amos GilatPublisher:John Wiley & Sons Inc
 Probability and Statistics for Engineering and th...StatisticsISBN:9781305251809Author:Jay L. DevorePublisher:Cengage Learning
 Statistics for The Behavioral Sciences (MindTap C...StatisticsISBN:9781305504912Author:Frederick J Gravetter, Larry B. WallnauPublisher:Cengage Learning
 Elementary Statistics: Picturing the World (7th E...StatisticsISBN:9780134683416Author:Ron Larson, Betsy FarberPublisher:PEARSON
 The Basic Practice of StatisticsStatisticsISBN:9781319042578Author:David S. Moore, William I. Notz, Michael A. FlignerPublisher:W. H. Freeman
 Introduction to the Practice of StatisticsStatisticsISBN:9781319013387Author:David S. Moore, George P. McCabe, Bruce A. CraigPublisher:W. H. Freeman
MATLAB: An Introduction with Applications
Statistics
ISBN:9781119256830
Author:Amos Gilat
Publisher:John Wiley & Sons Inc
Probability and Statistics for Engineering and th...
Statistics
ISBN:9781305251809
Author:Jay L. Devore
Publisher:Cengage Learning
Statistics for The Behavioral Sciences (MindTap C...
Statistics
ISBN:9781305504912
Author:Frederick J Gravetter, Larry B. Wallnau
Publisher:Cengage Learning
Elementary Statistics: Picturing the World (7th E...
Statistics
ISBN:9780134683416
Author:Ron Larson, Betsy Farber
Publisher:PEARSON
The Basic Practice of Statistics
Statistics
ISBN:9781319042578
Author:David S. Moore, William I. Notz, Michael A. Fligner
Publisher:W. H. Freeman
Introduction to the Practice of Statistics
Statistics
ISBN:9781319013387
Author:David S. Moore, George P. McCabe, Bruce A. Craig
Publisher:W. H. Freeman
How to make Frequency Distribution Table / Tally Marks and Frequency Distribution Table; Author: Reenu Math;https://www.youtube.com/watch?v=i_A6RiE8tLE;License: Standard YouTube License, CC-BY
Frequency distribution table in statistics; Author: Math and Science;https://www.youtube.com/watch?v=T7KYO76DoOE;License: Standard YouTube License, CC-BY
Frequency Distribution Table for Grouped/Continuous data | Math Dot Com; Author: Maths dotcom;https://www.youtube.com/watch?v=ErnccbXQOPY;License: Standard Youtube License