
Concept explainers
Videos
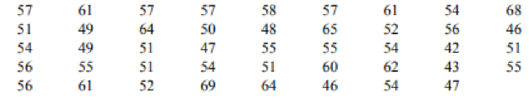
Ages of Presidents at Inauguration
The data represent the ages of our Presidents at the time they were first inaugurated.
1. Were the data obtained from a population or a sample? Explain your answer.
2. What was the age of the oldest President?
3. What was the age of the youngest President?
4. Construct a frequency distribution for the data. (Use your own judgment as to the number of classes and class size.)
5. Are there any peaks in the distribution?
6. Identify any possible outliers.
7. Write a brief summary of the nature of the data as shown in the frequency distribution.
(1)
To explain: Whether the given data is obtained from a population or a sample.
Answer to Problem 1AC
The given data is obtained from a population.
Explanation of Solution
Given info:
The below data shows the ages of our presidents at time they were first inaugurated.
| 57 | 61 | 57 | 57 | 58 | 57 | 61 | 54 | 68 |
| 51 | 49 | 64 | 50 | 48 | 65 | 52 | 56 | 46 |
| 54 | 49 | 51 | 47 | 55 | 55 | 54 | 42 | 51 |
| 56 | 55 | 51 | 54 | 51 | 60 | 62 | 43 | 55 |
| 56 | 61 | 52 | 69 | 64 | 46 | 54 | 47 |
Justification:
The population is the universal set under study and the sample is the small subset of the population.
Since, the data represent the ages of all the presidents at the time they were first inaugurate; therefore all the presidents are included under study.
Therefore, the given data is obtained from a population.
(2)
The age of the oldest president.
Answer to Problem 1AC
The age of the oldest president is 69 years.
Explanation of Solution
Given info:
The below data shows the ages of our presidents at time they were first inaugurated.
| 57 | 61 | 57 | 57 | 58 | 57 | 61 | 54 | 68 |
| 51 | 49 | 64 | 50 | 48 | 65 | 52 | 56 | 46 |
| 54 | 49 | 51 | 47 | 55 | 55 | 54 | 42 | 51 |
| 56 | 55 | 51 | 54 | 51 | 60 | 62 | 43 | 55 |
| 56 | 61 | 52 | 69 | 64 | 46 | 54 | 47 |
Calculation:
The given data represents the ages of our presidents at time they were first inaugurated. The maximum number in the given data represents the age of oldest president and the minimum number in the given data represents the age of the youngest president.
From the given data it is noticed that the maximum number in the data is 69, it means the age of the present is 69 years at time he was first inaugurated.
Therefore, the age of the oldest president is 69 years.
(3)
The age of the youngest president.
Answer to Problem 1AC
The age of the youngest president is 42 years.
Explanation of Solution
Given info:
The below data shows the ages of our presidents at time they were first inaugurated.
| 57 | 61 | 57 | 57 | 58 | 57 | 61 | 54 | 68 |
| 51 | 49 | 64 | 50 | 48 | 65 | 52 | 56 | 46 |
| 54 | 49 | 51 | 47 | 55 | 55 | 54 | 42 | 51 |
| 56 | 55 | 51 | 54 | 51 | 60 | 62 | 43 | 55 |
| 56 | 61 | 52 | 69 | 64 | 46 | 54 | 47 |
Calculation:
The given data represents the ages of our presidents at time they were first inaugurated. The maximum number in the given data represents the age of oldest president and the minimum number in the given data represents the age of the youngest president.
From the given data it is noticed that the minimum number in the data is 42, it means the age of the present is 42 years at time he was first inaugurated
Therefore, the age of the youngest president is 42 years.
(4)
A frequency distribution for the given data.
Answer to Problem 1AC
The frequency distribution with 7 classes is given in following table:
| Class limits | Frequency |
| 42-45 | 2 |
| 46-49 | 7 |
| 50-53 | 8 |
| 54-57 | 16 |
| 58-61 | 5 |
| 62-65 | 4 |
| 66-69 | 2 |
Explanation of Solution
Given info:
The below shows the ages of our presidents at time they were first inaugurated.
| 57 | 61 | 57 | 57 | 58 | 57 | 61 | 54 | 68 |
| 51 | 49 | 64 | 50 | 48 | 65 | 52 | 56 | 46 |
| 54 | 49 | 51 | 47 | 55 | 55 | 54 | 42 | 51 |
| 56 | 55 | 51 | 54 | 51 | 60 | 62 | 43 | 55 |
| 56 | 61 | 52 | 69 | 64 | 46 | 54 | 47 |
Calculation:
Assume that the number of classes for the frequency distribution is 7. The answer will vary according to the number of classes.
The highest value is 69 and the lowest value is 42.
The range is the difference of highest value and the lowest value.
The range is 27.
The class width is the ratio of range and classes.
The class width is 4.
Add the width to the smallest term of the data to get the lower limit of the next class and add up to 7 classes.
So the lower limits of all the 7 classes are, 42,46,50,54,58,62,66.
Subtract 1 from the lower limit of the second class to get the upper limit of the first class, then add the width to each upper limit in every class to get all the upper limits.
The first class is 42-45, the second class is 46-49, the third class is 50-53, the fourth class is 54-57, the fifth class is 58-61, the sixth class is 62-65 and the seventh class is 66-69.
To find the class boundaries, subtract 0.5 from each lower class limit and add 0.5 to each upper class limit.
Tally the data and find the numerical frequencies from the tallies.
The frequency distribution is given below:
| Class limits | Class boundaries | Tally | Frequency |
| 42-45 | 41.5 - 45.5 |
|
2 |
| 46-49 | 45.5 - 49.5 |
|
7 |
| 50-53 | 49.5 - 53.5 |
|
8 |
| 54-57 | 53.5 - 57.5 |
|
16 |
| 58-61 | 57.5 - 61.5 |
|
5 |
| 62-65 | 61.5 - 65.5 |
|
4 |
| 66-69 | 65.5 - 69.5 |
|
2 |
Therefore, the above table shows the frequency distribution for the given data.
(5)
The peak in the distribution.
Answer to Problem 1AC
The peak for the frequency distribution is 16 for the class
Explanation of Solution
Given info:
The below shows the ages of our presidents at time they were first inaugurated.
| 57 | 61 | 57 | 57 | 58 | 57 | 61 | 54 | 68 |
| 51 | 49 | 64 | 50 | 48 | 65 | 52 | 56 | 46 |
| 54 | 49 | 51 | 47 | 55 | 55 | 54 | 42 | 51 |
| 56 | 55 | 51 | 54 | 51 | 60 | 62 | 43 | 55 |
| 56 | 61 | 52 | 69 | 64 | 46 | 54 | 47 |
Calculation:
From part (4), the frequency distribution for the given data is shown below,
| Class limits | Frequency |
| 42-45 | 2 |
| 46-49 | 7 |
| 50-53 | 8 |
| 54-57 | 16 |
| 58-61 | 5 |
| 62-65 | 4 |
| 66-69 | 2 |
From the above table, it is clearly noticed that the highest frequency is 16 for the class
Therefore, the peak for the frequency distribution is 16 for the class
(6)
The possible outliers for the frequency distribution of the given data.
Answer to Problem 1AC
The frequency distribution of the given data has no outliers.
Explanation of Solution
Given info:
The below shows the ages of our presidents at time they were first inaugurated.
| 57 | 61 | 57 | 57 | 58 | 57 | 61 | 54 | 68 |
| 51 | 49 | 64 | 50 | 48 | 65 | 52 | 56 | 46 |
| 54 | 49 | 51 | 47 | 55 | 55 | 54 | 42 | 51 |
| 56 | 55 | 51 | 54 | 51 | 60 | 62 | 43 | 55 |
| 56 | 61 | 52 | 69 | 64 | 46 | 54 | 47 |
Calculation:
Sort the given data in increasing order.
| 42 | 50 | 54 | 56 | 61 |
| 43 | 51 | 54 | 56 | 61 |
| 46 | 51 | 54 | 57 | 62 |
| 46 | 51 | 54 | 57 | 64 |
| 47 | 51 | 55 | 57 | 64 |
| 47 | 51 | 55 | 57 | 65 |
| 48 | 52 | 55 | 58 | 68 |
| 49 | 52 | 55 | 60 | 69 |
| 49 | 54 | 56 | 61 |
The total terms are 44, the value of n is 44 which is an even number.
Formula for first quartile is,
Substitute
Formula for third quartile is,
Substitute
The value of first quartile is 51 and value of third quartile is 57.5.
Formula for inter quartile range is,
Multiply the above value by 1.5.
Subtract the above value from
Add the value 9.75 in
If any value lies outside the interval from 41.25 to 67.25, then it is consider as outliers.
The frequency distribution of part (4), shows that there is no outliers.
Therefore, the frequency distribution of the given data has no outliers.
(7)
To explain: The nature of the given data.
Answer to Problem 1AC
The given data appears to be fairly symmetric, with center on 55 years of age.
Explanation of Solution
The below shows the ages of our presidents at time they were first inaugurated.
| 57 | 61 | 57 | 57 | 58 | 57 | 61 | 54 | 68 |
| 51 | 49 | 64 | 50 | 48 | 65 | 52 | 56 | 46 |
| 54 | 49 | 51 | 47 | 55 | 55 | 54 | 42 | 51 |
| 56 | 55 | 51 | 54 | 51 | 60 | 62 | 43 | 55 |
| 56 | 61 | 52 | 69 | 64 | 46 | 54 | 47 |
From the above table, it is noticed that the date is fairly symmetric, centering on 55 and the graph of the given data is bell shaped.
Therefore, the given data appears to be fairly symmetric, with center on 55 years of age.
Want to see more full solutions like this?
Chapter 2 Solutions
Elementary Statistics: A Step By Step Approach
Additional Math Textbook Solutions
Math in Our World
Mathematics for the Trades: A Guided Approach (11th Edition) (What's New in Trade Math)
Elementary Statistics: Picturing the World (7th Edition)
Introductory Statistics
Elementary & Intermediate Algebra
APPLIED STAT.IN BUS.+ECONOMICS


- 4 (MLE of ARCH) Suppose rt follows ARCH(2) with E(rt) = 0, rt = ut, ut = στει, σε where {+} is a sequence of independent and identically distributed (iid) standard normal random variables. With observations r₁,...,, write down the log-likelihood function for the model esti- mation.arrow_forward5 (Moments of GARCH) For the GARCH(2,2) model rt = 0.2+0.25u1+0.05u-2 +0.30% / -1 +0.20% -2, find cov(rt). 0.0035 ut, ut = στει,στ =arrow_forwardDefinition of null hypothesis from the textbook Definition of alternative hypothesis from the textbook Imagine this: you suspect your beloved Chicken McNugget is shrinking. Inflation is hitting everything else, so why not the humble nugget too, right? But your sibling thinks you’re just being dramatic—maybe you’re just extra hungry today. Determined to prove them wrong, you take matters (and nuggets) into your own hands. You march into McDonald’s, get two 20-piece boxes, and head home like a scientist on a mission. Now, before you start weighing each nugget like they’re precious gold nuggets, let’s talk hypotheses. The average weight of nuggets as mentioned on the box is 16 g each. Develop your null and alternative hypotheses separately. Next, you weigh each nugget with the precision of a jeweler and find they average out to 15.5 grams. You also conduct a statistical analysis, and the p-value turns out to be 0.01. Based on this information, answer the following questions. (Remember,…arrow_forward
- Business Discussarrow_forwardCape Fear Community Colle X ALEKS ALEKS - Dorothy Smith - Sec X www-awu.aleks.com/alekscgi/x/Isl.exe/10_u-IgNslkr7j8P3jH-IQ1w4xc5zw7yX8A9Q43nt5P1XWJWARE... Section 7.1,7.2,7.3 HW 三 Question 21 of 28 (1 point) | Question Attempt: 5 of Unlimited The proportion of phones that have more than 47 apps is 0.8783 Part: 1 / 2 Part 2 of 2 (b) Find the 70th The 70th percentile of the number of apps. Round the answer to two decimal places. percentile of the number of apps is Try again Skip Part Recheck Save 2025 Mcarrow_forwardHi, I need to sort out where I went wrong. So, please us the data attached and run four separate regressions, each using the Recruiters rating as the dependent variable and GMAT, Accept Rate, Salary, and Enrollment, respectively, as a single independent variable. Interpret this equation. Round your answers to four decimal places, if necessary. If your answer is negative number, enter "minus" sign. Equation for GMAT: Ŷ = _______ + _______ GMAT Equation for Accept Rate: Ŷ = _______ + _______ Accept Rate Equation for Salary: Ŷ = _______ + _______ Salary Equation for Enrollment: Ŷ = _______ + _______ Enrollmentarrow_forward
- Question 21 of 28 (1 point) | Question Attempt: 5 of Unlimited Dorothy ✔ ✓ 12 ✓ 13 ✓ 14 ✓ 15 ✓ 16 ✓ 17 ✓ 18 ✓ 19 ✓ 20 = 21 22 > How many apps? According to a website, the mean number of apps on a smartphone in the United States is 82. Assume the number of apps is normally distributed with mean 82 and standard deviation 30. Part 1 of 2 (a) What proportion of phones have more than 47 apps? Round the answer to four decimal places. The proportion of phones that have more than 47 apps is 0.8783 Part: 1/2 Try again kip Part ی E Recheck == == @ W D 80 F3 151 E R C レ Q FA 975 % T B F5 10 の 000 园 Save For Later Submit Assignment © 2025 McGraw Hill LLC. All Rights Reserved. Terms of Use | Privacy Center | Accessibility Y V& U H J N * 8 M I K O V F10 P = F11 F12 . darrow_forwardYou are provided with data that includes all 50 states of the United States. Your task is to draw a sample of: 20 States using Random Sampling (2 points: 1 for random number generation; 1 for random sample) 10 States using Systematic Sampling (4 points: 1 for random numbers generation; 1 for generating random sample different from the previous answer; 1 for correct K value calculation table; 1 for correct sample drawn by using systematic sampling) (For systematic sampling, do not use the original data directly. Instead, first randomize the data, and then use the randomized dataset to draw your sample. Furthermore, do not use the random list previously generated, instead, generate a new random sample for this part. For more details, please see the snapshot provided at the end.) You are provided with data that includes all 50 states of the United States. Your task is to draw a sample of: o 20 States using Random Sampling (2 points: 1 for random number generation; 1 for random sample) o…arrow_forwardCourse Home ✓ Do Homework - Practice Ques ✓ My Uploads | bartleby + mylab.pearson.com/Student/PlayerHomework.aspx?homeworkId=688589738&questionId=5&flushed=false&cid=8110079¢erwin=yes Online SP 2025 STA 2023-009 Yin = Homework: Practice Questions Exam 3 Question list * Question 3 * Question 4 ○ Question 5 K Concluir atualização: Ava Pearl 04/02/25 9:28 AM HW Score: 71.11%, 12.09 of 17 points ○ Points: 0 of 1 Save Listed in the accompanying table are weights (kg) of randomly selected U.S. Army male personnel measured in 1988 (from "ANSUR I 1988") and different weights (kg) of randomly selected U.S. Army male personnel measured in 2012 (from "ANSUR II 2012"). Assume that the two samples are independent simple random samples selected from normally distributed populations. Do not assume that the population standard deviations are equal. Complete parts (a) and (b). Click the icon to view the ANSUR data. a. Use a 0.05 significance level to test the claim that the mean weight of the 1988…arrow_forward
- solving problem 1arrow_forwardselect bmw stock. you can assume the price of the stockarrow_forwardThis problem is based on the fundamental option pricing formula for the continuous-time model developed in class, namely the value at time 0 of an option with maturity T and payoff F is given by: We consider the two options below: Fo= -rT = e Eq[F]. 1 A. An option with which you must buy a share of stock at expiration T = 1 for strike price K = So. B. An option with which you must buy a share of stock at expiration T = 1 for strike price K given by T K = T St dt. (Note that both options can have negative payoffs.) We use the continuous-time Black- Scholes model to price these options. Assume that the interest rate on the money market is r. (a) Using the fundamental option pricing formula, find the price of option A. (Hint: use the martingale properties developed in the lectures for the stock price process in order to calculate the expectations.) (b) Using the fundamental option pricing formula, find the price of option B. (c) Assuming the interest rate is very small (r ~0), use Taylor…arrow_forward
 Glencoe Algebra 1, Student Edition, 9780079039897...AlgebraISBN:9780079039897Author:CarterPublisher:McGraw Hill
 Holt Mcdougal Larson Pre-algebra: Student Edition...AlgebraISBN:9780547587776Author:HOLT MCDOUGALPublisher:HOLT MCDOUGAL
 Big Ideas Math A Bridge To Success Algebra 1: Stu...AlgebraISBN:9781680331141Author:HOUGHTON MIFFLIN HARCOURTPublisher:Houghton Mifflin Harcourt