Bundle: Understandable Statistics, Loose-leaf Version, 12th + WebAssign Printed Access Card for Brase/Brase's Understandable Statistics: Concepts and Methods, 12th Edition, Single-Term
12th Edition
ISBN: 9781337605182
Author: Charles Henry Brase, Corrinne Pellillo Brase
Publisher: Cengage Learning
expand_more
expand_more
format_list_bulleted
Concept explainers
Videos
Textbook Question
Chapter 2.1, Problem 11P
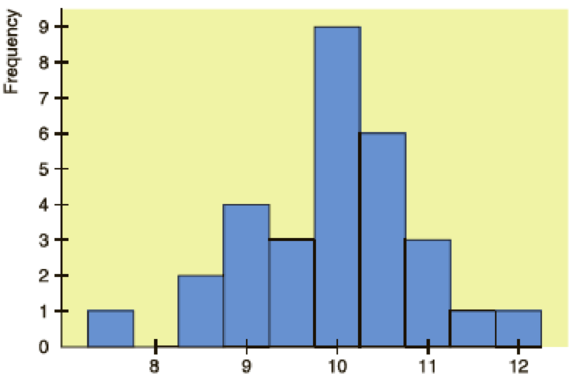
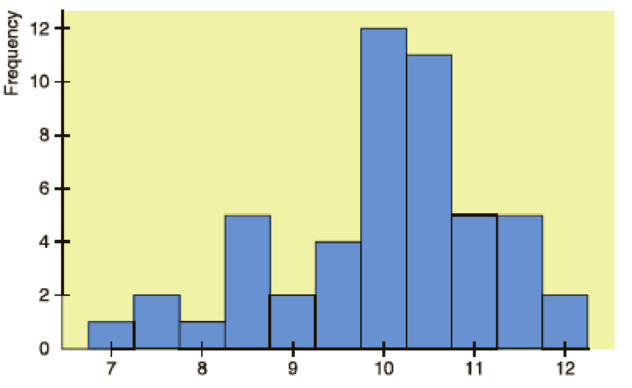
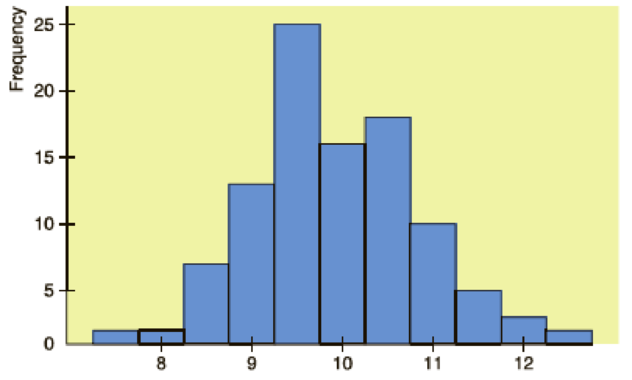
Interpretation Histograms of random sample data are often used as an indication of the shape of the underlying population distribution. The histograms on the next page are based on random samples of size 30, 50, and 100 from the same population.
- (a) Using the midpoint labels of the three histograms, what would you say about the estimated
range of the population data from smallest to largest? Does the bulk of the data seem to be between 8 and 12 in all three histograms? - (b) The population distribution from which the samples were drawn is symmetric and mound-shaped, with the top of the mound at 10, 95% of the data between 8 and 12, and 99.7% of data between 7 and 13. How well does each histogram reflect these characteristics?
- (i)
Sample of size 30
- (i)
- (ii) Sample of size 50
- (iii) Sample of size 100
Expert Solution & Answer
Want to see the full answer?
Check out a sample textbook solution
Students have asked these similar questions
Illustrate 2/7×4/5 using a rectangular region. Explain your work. 
Write three other different proportions equivalent to the following using the same values as in the given proportion 3 foot over 1 yard equals X feet over 5 yards
2. An experiment is set up to test the effectiveness of a new drug for balancing
people's mood. The table below contains the results of the patients before and
after taking the drug. The possible scores are the integers from 0 to 10, where
0 indicates a depressed mood and 10 indicates and elated mood.
Patient Before
After
1
4
4
2
3
3
3
6
4
4
1
2
5
6
5
6
1
3
7
4
7
8
6
9
1
4
10
5
4
Assuming the differences of the observations to be symmetric, but not normally
distributed, investigate the effectiveness of the drug at the 5% significance level.
[4 Marks]
Chapter 2 Solutions
Bundle: Understandable Statistics, Loose-leaf Version, 12th + WebAssign Printed Access Card for Brase/Brase's Understandable Statistics: Concepts and Methods, 12th Edition, Single-Term
Ch. 2.1 - Statistical Literacy What is the difference...Ch. 2.1 - Statistical Literacy A data set has values ranging...Ch. 2.1 - Statistical Literacy A data set has values ranging...Ch. 2.1 - Prob. 4PCh. 2.1 - Basic Computation: Class Limits A data set with...Ch. 2.1 - Prob. 6PCh. 2.1 - Interpretation You are manager of a specialty...Ch. 2.1 - Prob. 8PCh. 2.1 - Critical Thinking Look at the histogram in Figure...Ch. 2.1 - Critical Thinking The following data represent...
Ch. 2.1 - Interpretation Histograms of random sample data...Ch. 2.1 - Prob. 12PCh. 2.1 - Interpretation The ogives shown are based on U.S....Ch. 2.1 - Prob. 14PCh. 2.1 - For Problems 15-20, use the specified number of...Ch. 2.1 - For Problems 15-20, use the specified number of...Ch. 2.1 - For Problems 15-20, use the specified number of...Ch. 2.1 - Prob. 18PCh. 2.1 - For Problems 15-20, use the specified number of...Ch. 2.1 - Prob. 20PCh. 2.1 - Expand Your Knowledge: Decimal Data The following...Ch. 2.1 - Decimal Data: Batting Averages The following data...Ch. 2.1 - Expand Your Knowledge: Dotplot Another display...Ch. 2.1 - Prob. 24PCh. 2.1 - Dotplot: Tumor Recurrence Make a dotplot for the...Ch. 2.2 - Interpretation Consider graph (a) of Reasons...Ch. 2.2 - Reasons People Like Texting on Cell Phones (b)...Ch. 2.2 - Critical Thinking A personnel office is gathering...Ch. 2.2 - Prob. 4PCh. 2.2 - Education: Does College Pay Off? It is costly in...Ch. 2.2 - Prob. 6PCh. 2.2 - Commercial Fishing: Gulf of Alaska Its not an easy...Ch. 2.2 - Prob. 8PCh. 2.2 - Lifestyle: Hide the Mess! A survey of 1000 adults...Ch. 2.2 - Prob. 10PCh. 2.2 - FBI Report: Hawaii In the Aloha state, you are...Ch. 2.2 - Prob. 12PCh. 2.2 - Prob. 13PCh. 2.2 - Prob. 14PCh. 2.2 - Prob. 15PCh. 2.2 - Prob. 16PCh. 2.3 - Cowboys: Longevity How long did real cowboys live?...Ch. 2.3 - Ecology: Habitat Wetlands offer a diversity of...Ch. 2.3 - Health Care: Hospitals The American Medical...Ch. 2.3 - Health Care: Hospitals Using the number of...Ch. 2.3 - Expand Your Knowledge: Split Stem The Boston...Ch. 2.3 - Prob. 6PCh. 2.3 - Prob. 7PCh. 2.3 - Prob. 8PCh. 2.3 - Prob. 9PCh. 2.3 - Prob. 10PCh. 2 - Prob. 1CRPCh. 2 - Critical Thinking A consumer interest group is...Ch. 2 - Prob. 3CRPCh. 2 - Prob. 4CRPCh. 2 - Prob. 5CRPCh. 2 - Prob. 6CRPCh. 2 - Prob. 7CRPCh. 2 - Prob. 8CRPCh. 2 - Prob. 9CRPCh. 2 - Prob. 10CRPCh. 2 - Prob. 11CRPCh. 2 - Prob. 12CRPCh. 2 - Prob. 1DHCh. 2 - Prob. 2DHCh. 2 - In your own words, explain the differences among...Ch. 2 - What do we mean when we say a histogram is skewed...Ch. 2 - Discuss the statement that stem-and-leaf displays...Ch. 2 - Prob. 1UTCh. 2 - Prob. 2UTCh. 2 - Prob. 3UT
Knowledge Booster


Learn more about
Need a deep-dive on the concept behind this application? Look no further. Learn more about this topic, statistics and related others by exploring similar questions and additional content below.Similar questions
- 3. (i) Consider the following R code: wilcox.test(UK Supermarkets $Salary ~ UKSupermarkets $Supermarket) (a) Which test is being used in this code? (b) What is the name of the dataset under consideration? How would be adapt this code if we had ties? What other command can be used which deals with ties? (ii) Consider the following R code: install packages("nortest") library(nortest) lillie.test (Differences) (a) Assuming the appropriate dataset has been imported and attached, what is wrong with this code? (b) If this code were to be corrected, what would be determined by run- ning it? [3 Marks]arrow_forward1. (i) Explain the difference in application between the Mann-Whitney U test and the Wilcoxon Signed-Rank test, i.e. in which scenarios would each test be used? (ii) What is the main procedure underlying these nonparametric tests? [3 Marks]arrow_forwardYou may need to use the appropriate appendix table or technology to answer this question. You are given the following information obtained from a random sample of 4 observations. 24 48 31 57 You want to determine whether or not the mean of the population from which this sample was taken is significantly different from 49. (Assume the population is normally distributed.) (a) State the null and the alternative hypotheses. (Enter != for ≠ as needed.) H0: Ha: (b) Determine the test statistic. (Round your answer to three decimal places.) (c) Determine the p-value, and at the 5% level of significance, test to determine whether or not the mean of the population is significantly different from 49. Find the p-value. (Round your answer to four decimal places.) p-value = State your conclusion. Reject H0. There is insufficient evidence to conclude that the mean of the population is different from 49.Do not reject H0. There is sufficient evidence to conclude that the…arrow_forward
- 65% of all violent felons in the prison system are repeat offenders. If 43 violent felons are randomly selected, find the probability that a. Exactly 28 of them are repeat offenders. b. At most 28 of them are repeat offenders. c. At least 28 of them are repeat offenders. d. Between 22 and 26 (including 22 and 26) of them are repeat offenders.arrow_forward08:34 ◄ Classroom 07:59 Probs. 5-32/33 D ا. 89 5-34. Determine the horizontal and vertical components of reaction at the pin A and the normal force at the smooth peg B on the member. A 0,4 m 0.4 m Prob. 5-34 F=600 N fr th ar 0. 163586 5-37. The wooden plank resting between the buildings deflects slightly when it supports the 50-kg boy. This deflection causes a triangular distribution of load at its ends. having maximum intensities of w, and wg. Determine w and wg. each measured in N/m. when the boy is standing 3 m from one end as shown. Neglect the mass of the plank. 0.45 m 3 marrow_forwardExamine the Variables: Carefully review and note the names of all variables in the dataset. Examples of these variables include: Mileage (mpg) Number of Cylinders (cyl) Displacement (disp) Horsepower (hp) Research: Google to understand these variables. Statistical Analysis: Select mpg variable, and perform the following statistical tests. Once you are done with these tests using mpg variable, repeat the same with hp Mean Median First Quartile (Q1) Second Quartile (Q2) Third Quartile (Q3) Fourth Quartile (Q4) 10th Percentile 70th Percentile Skewness Kurtosis Document Your Results: In RStudio: Before running each statistical test, provide a heading in the format shown at the bottom. “# Mean of mileage – Your name’s command” In Microsoft Word: Once you've completed all tests, take a screenshot of your results in RStudio and paste it into a Microsoft Word document. Make sure that snapshots are very clear. You will need multiple snapshots. Also transfer these results to the…arrow_forward
- Examine the Variables: Carefully review and note the names of all variables in the dataset. Examples of these variables include: Mileage (mpg) Number of Cylinders (cyl) Displacement (disp) Horsepower (hp) Research: Google to understand these variables. Statistical Analysis: Select mpg variable, and perform the following statistical tests. Once you are done with these tests using mpg variable, repeat the same with hp Mean Median First Quartile (Q1) Second Quartile (Q2) Third Quartile (Q3) Fourth Quartile (Q4) 10th Percentile 70th Percentile Skewness Kurtosis Document Your Results: In RStudio: Before running each statistical test, provide a heading in the format shown at the bottom. “# Mean of mileage – Your name’s command” In Microsoft Word: Once you've completed all tests, take a screenshot of your results in RStudio and paste it into a Microsoft Word document. Make sure that snapshots are very clear. You will need multiple snapshots. Also transfer these results to the…arrow_forwardExamine the Variables: Carefully review and note the names of all variables in the dataset. Examples of these variables include: Mileage (mpg) Number of Cylinders (cyl) Displacement (disp) Horsepower (hp) Research: Google to understand these variables. Statistical Analysis: Select mpg variable, and perform the following statistical tests. Once you are done with these tests using mpg variable, repeat the same with hp Mean Median First Quartile (Q1) Second Quartile (Q2) Third Quartile (Q3) Fourth Quartile (Q4) 10th Percentile 70th Percentile Skewness Kurtosis Document Your Results: In RStudio: Before running each statistical test, provide a heading in the format shown at the bottom. “# Mean of mileage – Your name’s command” In Microsoft Word: Once you've completed all tests, take a screenshot of your results in RStudio and paste it into a Microsoft Word document. Make sure that snapshots are very clear. You will need multiple snapshots. Also transfer these results to the…arrow_forward2 (VaR and ES) Suppose X1 are independent. Prove that ~ Unif[-0.5, 0.5] and X2 VaRa (X1X2) < VaRa(X1) + VaRa (X2). ~ Unif[-0.5, 0.5]arrow_forward
- 8 (Correlation and Diversification) Assume we have two stocks, A and B, show that a particular combination of the two stocks produce a risk-free portfolio when the correlation between the return of A and B is -1.arrow_forward9 (Portfolio allocation) Suppose R₁ and R2 are returns of 2 assets and with expected return and variance respectively r₁ and 72 and variance-covariance σ2, 0%½ and σ12. Find −∞ ≤ w ≤ ∞ such that the portfolio wR₁ + (1 - w) R₂ has the smallest risk.arrow_forward7 (Multivariate random variable) Suppose X, €1, €2, €3 are IID N(0, 1) and Y2 Y₁ = 0.2 0.8X + €1, Y₂ = 0.3 +0.7X+ €2, Y3 = 0.2 + 0.9X + €3. = (In models like this, X is called the common factors of Y₁, Y₂, Y3.) Y = (Y1, Y2, Y3). (a) Find E(Y) and cov(Y). (b) What can you observe from cov(Y). Writearrow_forward
arrow_back_ios
SEE MORE QUESTIONS
arrow_forward_ios
Recommended textbooks for you
 Glencoe Algebra 1, Student Edition, 9780079039897...AlgebraISBN:9780079039897Author:CarterPublisher:McGraw Hill
 Big Ideas Math A Bridge To Success Algebra 1: Stu...AlgebraISBN:9781680331141Author:HOUGHTON MIFFLIN HARCOURTPublisher:Houghton Mifflin Harcourt
 Holt Mcdougal Larson Pre-algebra: Student Edition...AlgebraISBN:9780547587776Author:HOLT MCDOUGALPublisher:HOLT MCDOUGAL
Glencoe Algebra 1, Student Edition, 9780079039897...
Algebra
ISBN:9780079039897
Author:Carter
Publisher:McGraw Hill
Big Ideas Math A Bridge To Success Algebra 1: Stu...
Algebra
ISBN:9781680331141
Author:HOUGHTON MIFFLIN HARCOURT
Publisher:Houghton Mifflin Harcourt
Holt Mcdougal Larson Pre-algebra: Student Edition...
Algebra
ISBN:9780547587776
Author:HOLT MCDOUGAL
Publisher:HOLT MCDOUGAL
The Shape of Data: Distributions: Crash Course Statistics #7; Author: CrashCourse;https://www.youtube.com/watch?v=bPFNxD3Yg6U;License: Standard YouTube License, CC-BY
Shape, Center, and Spread - Module 20.2 (Part 1); Author: Mrmathblog;https://www.youtube.com/watch?v=COaid7O_Gag;License: Standard YouTube License, CC-BY
Shape, Center and Spread; Author: Emily Murdock;https://www.youtube.com/watch?v=_YyW0DSCzpM;License: Standard Youtube License