Bundle: Understandable Statistics, Loose-leaf Version, 12th + WebAssign Printed Access Card for Brase/Brase's Understandable Statistics: Concepts and Methods, 12th Edition, Single-Term
12th Edition
ISBN: 9781337605182
Author: Charles Henry Brase, Corrinne Pellillo Brase
Publisher: Cengage Learning
expand_more
expand_more
format_list_bulleted
Concept explainers
Videos
Textbook Question
Chapter 2.1, Problem 23P
Expand Your Knowledge: Dotplot Another display technique that is somewhat similar to a histogram is a dotplot. In a dotplot, the data values are displayed along the horizontal axis. A dot is then plotted over each data value in the data set.
The next display shows a dotplot generated by Minitab (➤Graph ➤Dotplot) for the number of licensed drivers per 1000 residents by state, including the District of Columbia (Source: U.S. Department of Transportation).
Dotplot for Licensed Drivers per 1000 Residents
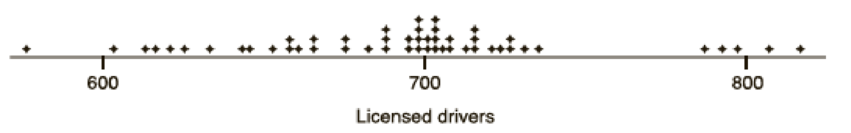
- (a) From the dotplot, how many states have 600 or fewer licensed drivers per 1000 residents?
- (b) About what percentage of the states (out of 51) seem to have close to 800 licensed drivers per 1000 residents?
- (c) Consider the intervals 550 to 650, 650 to 750, and 750 to 850 licensed drivers per 1000 residents. In which interval do most of the states fall?
Expert Solution & Answer

Trending nowThis is a popular solution!

Students have asked these similar questions
Find the critical value for a left-tailed test using the F distribution with a 0.025, degrees of freedom in the numerator=12, and degrees of freedom in the
denominator = 50. A portion of the table of critical values of the F-distribution is provided.
Click the icon to view the partial table of critical values of the F-distribution.
What is the critical value?
(Round to two decimal places as needed.)
A retail store manager claims that the average daily sales of the store are $1,500.
You aim to test whether the actual average daily sales differ significantly from this claimed value.
You can provide your answer by inserting a text box and the answer must include:
Null hypothesis,
Alternative hypothesis,
Show answer (output table/summary table), and
Conclusion based on the P value.
Showing the calculation is a must. If calculation is missing,so please provide a step by step on the answers
Numerical answers in the yellow cells
Show all work
Chapter 2 Solutions
Bundle: Understandable Statistics, Loose-leaf Version, 12th + WebAssign Printed Access Card for Brase/Brase's Understandable Statistics: Concepts and Methods, 12th Edition, Single-Term
Ch. 2.1 - Statistical Literacy What is the difference...Ch. 2.1 - Statistical Literacy A data set has values ranging...Ch. 2.1 - Statistical Literacy A data set has values ranging...Ch. 2.1 - Prob. 4PCh. 2.1 - Basic Computation: Class Limits A data set with...Ch. 2.1 - Prob. 6PCh. 2.1 - Interpretation You are manager of a specialty...Ch. 2.1 - Prob. 8PCh. 2.1 - Critical Thinking Look at the histogram in Figure...Ch. 2.1 - Critical Thinking The following data represent...
Ch. 2.1 - Interpretation Histograms of random sample data...Ch. 2.1 - Prob. 12PCh. 2.1 - Interpretation The ogives shown are based on U.S....Ch. 2.1 - Prob. 14PCh. 2.1 - For Problems 15-20, use the specified number of...Ch. 2.1 - For Problems 15-20, use the specified number of...Ch. 2.1 - For Problems 15-20, use the specified number of...Ch. 2.1 - Prob. 18PCh. 2.1 - For Problems 15-20, use the specified number of...Ch. 2.1 - Prob. 20PCh. 2.1 - Expand Your Knowledge: Decimal Data The following...Ch. 2.1 - Decimal Data: Batting Averages The following data...Ch. 2.1 - Expand Your Knowledge: Dotplot Another display...Ch. 2.1 - Prob. 24PCh. 2.1 - Dotplot: Tumor Recurrence Make a dotplot for the...Ch. 2.2 - Interpretation Consider graph (a) of Reasons...Ch. 2.2 - Reasons People Like Texting on Cell Phones (b)...Ch. 2.2 - Critical Thinking A personnel office is gathering...Ch. 2.2 - Prob. 4PCh. 2.2 - Education: Does College Pay Off? It is costly in...Ch. 2.2 - Prob. 6PCh. 2.2 - Commercial Fishing: Gulf of Alaska Its not an easy...Ch. 2.2 - Prob. 8PCh. 2.2 - Lifestyle: Hide the Mess! A survey of 1000 adults...Ch. 2.2 - Prob. 10PCh. 2.2 - FBI Report: Hawaii In the Aloha state, you are...Ch. 2.2 - Prob. 12PCh. 2.2 - Prob. 13PCh. 2.2 - Prob. 14PCh. 2.2 - Prob. 15PCh. 2.2 - Prob. 16PCh. 2.3 - Cowboys: Longevity How long did real cowboys live?...Ch. 2.3 - Ecology: Habitat Wetlands offer a diversity of...Ch. 2.3 - Health Care: Hospitals The American Medical...Ch. 2.3 - Health Care: Hospitals Using the number of...Ch. 2.3 - Expand Your Knowledge: Split Stem The Boston...Ch. 2.3 - Prob. 6PCh. 2.3 - Prob. 7PCh. 2.3 - Prob. 8PCh. 2.3 - Prob. 9PCh. 2.3 - Prob. 10PCh. 2 - Prob. 1CRPCh. 2 - Critical Thinking A consumer interest group is...Ch. 2 - Prob. 3CRPCh. 2 - Prob. 4CRPCh. 2 - Prob. 5CRPCh. 2 - Prob. 6CRPCh. 2 - Prob. 7CRPCh. 2 - Prob. 8CRPCh. 2 - Prob. 9CRPCh. 2 - Prob. 10CRPCh. 2 - Prob. 11CRPCh. 2 - Prob. 12CRPCh. 2 - Prob. 1DHCh. 2 - Prob. 2DHCh. 2 - In your own words, explain the differences among...Ch. 2 - What do we mean when we say a histogram is skewed...Ch. 2 - Discuss the statement that stem-and-leaf displays...Ch. 2 - Prob. 1UTCh. 2 - Prob. 2UTCh. 2 - Prob. 3UT
Knowledge Booster


Learn more about
Need a deep-dive on the concept behind this application? Look no further. Learn more about this topic, statistics and related others by exploring similar questions and additional content below.Similar questions
- Show all workarrow_forwardplease find the answers for the yellows boxes using the information and the picture belowarrow_forwardA marketing agency wants to determine whether different advertising platforms generate significantly different levels of customer engagement. The agency measures the average number of daily clicks on ads for three platforms: Social Media, Search Engines, and Email Campaigns. The agency collects data on daily clicks for each platform over a 10-day period and wants to test whether there is a statistically significant difference in the mean number of daily clicks among these platforms. Conduct ANOVA test. You can provide your answer by inserting a text box and the answer must include: also please provide a step by on getting the answers in excel Null hypothesis, Alternative hypothesis, Show answer (output table/summary table), and Conclusion based on the P value.arrow_forward
- A company found that the daily sales revenue of its flagship product follows a normal distribution with a mean of $4500 and a standard deviation of $450. The company defines a "high-sales day" that is, any day with sales exceeding $4800. please provide a step by step on how to get the answers Q: What percentage of days can the company expect to have "high-sales days" or sales greater than $4800? Q: What is the sales revenue threshold for the bottom 10% of days? (please note that 10% refers to the probability/area under bell curve towards the lower tail of bell curve) Provide answers in the yellow cellsarrow_forwardBusiness Discussarrow_forwardThe following data represent total ventilation measured in liters of air per minute per square meter of body area for two independent (and randomly chosen) samples. Analyze these data using the appropriate non-parametric hypothesis testarrow_forward
arrow_back_ios
SEE MORE QUESTIONS
arrow_forward_ios
Recommended textbooks for you
 Holt Mcdougal Larson Pre-algebra: Student Edition...AlgebraISBN:9780547587776Author:HOLT MCDOUGALPublisher:HOLT MCDOUGAL
 Big Ideas Math A Bridge To Success Algebra 1: Stu...AlgebraISBN:9781680331141Author:HOUGHTON MIFFLIN HARCOURTPublisher:Houghton Mifflin Harcourt
 Glencoe Algebra 1, Student Edition, 9780079039897...AlgebraISBN:9780079039897Author:CarterPublisher:McGraw Hill
 Functions and Change: A Modeling Approach to Coll...AlgebraISBN:9781337111348Author:Bruce Crauder, Benny Evans, Alan NoellPublisher:Cengage Learning
 Trigonometry (MindTap Course List)TrigonometryISBN:9781305652224Author:Charles P. McKeague, Mark D. TurnerPublisher:Cengage Learning
 College Algebra (MindTap Course List)AlgebraISBN:9781305652231Author:R. David Gustafson, Jeff HughesPublisher:Cengage Learning
Holt Mcdougal Larson Pre-algebra: Student Edition...
Algebra
ISBN:9780547587776
Author:HOLT MCDOUGAL
Publisher:HOLT MCDOUGAL
Big Ideas Math A Bridge To Success Algebra 1: Stu...
Algebra
ISBN:9781680331141
Author:HOUGHTON MIFFLIN HARCOURT
Publisher:Houghton Mifflin Harcourt
Glencoe Algebra 1, Student Edition, 9780079039897...
Algebra
ISBN:9780079039897
Author:Carter
Publisher:McGraw Hill
Functions and Change: A Modeling Approach to Coll...
Algebra
ISBN:9781337111348
Author:Bruce Crauder, Benny Evans, Alan Noell
Publisher:Cengage Learning
Trigonometry (MindTap Course List)
Trigonometry
ISBN:9781305652224
Author:Charles P. McKeague, Mark D. Turner
Publisher:Cengage Learning
College Algebra (MindTap Course List)
Algebra
ISBN:9781305652231
Author:R. David Gustafson, Jeff Hughes
Publisher:Cengage Learning
Which is the best chart: Selecting among 14 types of charts Part II; Author: 365 Data Science;https://www.youtube.com/watch?v=qGaIB-bRn-A;License: Standard YouTube License, CC-BY