
Videos
Hepatocellular carcinoma is the most frequent form of liver cancer. In a patient with heritable hepatocellular carcinoma, formation of the tumor was associated with eight genetic alterations affecting two different oncogenes and three different tumor-suppressor genes. These alterations are:
| i. | Mitotic recombination |
| ii. | A deletion of a chromosomal region |
| iii. | Trisomy |
| iv. | A duplication of a chromosomal region |
| v. | Uniparental disomy (see Fig. 20.24) |
| vi. | A point mutation |
| vii. | Another point mutation |
| viii. | Yet another point mutation |
For parts a–c below, supply all possible correct answers from the preceding list. Remember that the majority of point mutations are loss-of-function mutations.
| a. | Which of the mutations from the preceding list is likely to affect a proto-oncogene? |
| b. | Which of the mutations from the preceding list is likely to involve a tumor-suppressor gene? |
| c. | Which of the mutations from the preceding list involves copy-neutral loss-of-heterozygosity (that is, a loss-of-heterozygosity in which the genomes of the cancerous cells still have two copies of the gene in question, whether or not those copies are functional)? |
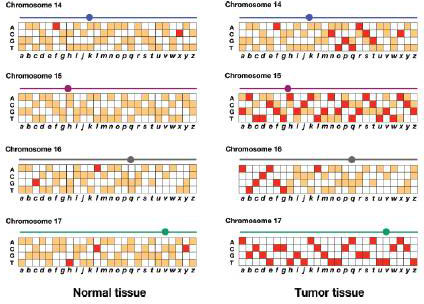
Genomic DNA is prepared from normal white blood cells and from a biopsy of the tumor in this patient. These genomic DNAs are prepared as fluorescent probes that are each hybridized to an ASO microarray of polymorphisms in the human genome (review Figs. 11.16 and 11.17). The results for SNPs a–z on chromosomes 14, 15, 16, and 17 are shown in the accompanying figure. Red and orange represent different levels of fluorescence.
| d. | Based on the microarray data, provide the most accurate localization of the first five types of genetic alterations in the list (i–v). For example, if an alteration involves markers a–e of chromosome 15, write 15a–e. |
| e. | As precisely as possible, indicate the location of the mitotic recombination event involved in the genesis of this cancer |
| f. | If these data allow you to map any of the three cancer-promoting point mutations, provide the most accurate mutation location(s) possible. |
| g. | Of all the genetic alterations i–viii, for which one do you see clear-cut evidence that the mutation or other event was inherited from a parent of the patient? |
| h. | For a tumor-suppressor gene to play a role in cancer, normally both of the copies in the tumor cells must be nonfunctional. For each of the three tumor-suppressor genes contributing to the cancer in this patient, provide a scenario explaining which two hits (i–viii in the list, with vi–viii equivalent) could be responsible, the order in which the hits must have occurred, and whether the hits in question could be inherited or could have occurred somatically. |
Want to see the full answer?
Check out a sample textbook solution
Chapter 20 Solutions
ND STONY BROOK UNIVERSITY LOOSELEAF GENETICS: FROM GENES TO GENOMES


- Describe how insulin binding to its receptor induces glucose uptake in healthy individuals. Please specifyeach step in the cascade and use a diagram to illustrate the answer.arrow_forwardThere is a patient with breast cancer, after staining the breast tissue with H&E, state the molecular subtype of the tumour extracted. Results of H&E staining are down belowarrow_forwardBiopharmaceutics and Pharmacokinetics:Two-Compartment Model Instant Absorption Questions Calculate these : a) B1, b) B2, c) hybrid rate constant (1) d) hybrid rate constant (2) e) t1/2,dist f) t1/2,elim g) k10 h) k12 i) k21 j) initial concentration (C0) k) central compartment volume (V1) l) steady-state volume (Vss) m) clearance (CL) AUC (0→10 min) using trapezoidal rule n) AUC (20→30 min) using trapezoidal rule o) AUCtail (AUC360→∞) p) total AUC (using short cut method) q) volume from AUC (VAUC)arrow_forward
- Use the Henderson-Hasselbalch equation for a propanoic acid solution (CH₂CH₂CO₂H, pK₁ = 4.874) to calculate the quotient [A-]/[HA] at three different pH values. pH = 4.479 [A-] [HA] [A-] pH = 4.874 [HA] = pH = 5.220 [A-] = [HA]arrow_forwardIn order to establish the expiration date of perishable food, growth curve data must be collected. Once the microbial load is so high that it poses a hazard to human health, the food item is no longer considered safe (expired). Generally a load of x50,000 bacteria/gram is considered unsafe. Your task is to determine the microbial growth curves for MicroYo, a new brand of yogurt. The growth is determined by sampling the yogurt and growing the bacterial isolates in broth culture which is then serially diluted by a total of x10,000 and inoculated onto standard petri plates of nutrient agar. The following colony counts are measured: Time (days) MicroYo colony count# 1 1 4 1 12 2 16 20 4 7 What day should you recommend expiring the yogurt (the last possible date before the microbial load is unsafe). 12 4 20 16arrow_forward9. Chicken combs in chickens is an example where you see interactions between genes. See potential genotypes and phenotypes below. Which genotype, when mated to a rose comb chicken, will produce progeny that are 50% walnut comb and 50% pea comb? walnut (RRPP) walnut (RrPP) pea (rrPP) walnut (RRPP) walnut (RrPp) pea (rrPp) rose rose single (RRPP) (Rrpp) (rrpp)arrow_forward
- Describe a compound light microscope and its importance in microbiology (2) examples of at least two microbes viewed under a compound light microscope and their general characteristics (note: the microbes you choose do not need to be the ones outlined in the above tutorial video) and (3) at least one source you used for the information included in your infographic.arrow_forwardPrice of visit Number of visits $700 0 $600 [1 $500 2 $400 3 $300 4 00000 The Table blow gives the demand curve for doctor visits for Elena. If the price of a doctor's visit is $600, and Elena does not have health insurance, she will visit the doctor times. If Elena obtains 50% coinsurance (the company pays 50% of the medical bill, Elena pays 50%), then Elena will visit the doctor times. 1; 2 0; 3 0; 2 1;4 2; 1arrow_forwardP 200 150- 100 50 w/instrance/ w/insurance 2 100 Demand Assume that the white curve (labeled "Demand") represents an individual's true demand for this particular health care service. The coinsurance associated with insurance option 1 (in blue) is likely _. 0000 100% 25% 50% 0%arrow_forward
- Use the figure below. Bob and Nancy have the same income and total utility.. willingness to pay for an insurance premium will be lower than because they are. risk- averse. Total utility Current utility Bob's utility Nancy's utility 0000 Bob; Nancy; less Nancy; Bob; less Nancy; Bob; more Bob; Nancy; more Current Income incomearrow_forwardConsider the figure below. Suppose the true price of a health care service is P1. Suppose further that the individual has obtained insurance that has a fixed copayment for this particular service. The copayment is represented by price P2. represents the quantity of the service the individual would consume without insurance. quantity of the service the individual would consume with the insurance. Health Care Service represents the P. P₂ a Q1;Q2 Q2; Q3 Q1; Q3 Q3; Q1 Q2; Q1 फ f Q ८ g d h Q3\D 7Q 00000arrow_forwardThe table shows the utility Jordan receives at various income levels, but they do not know what their income will be next year. There is a 15% chance their income will be $25,000, a 20% chance their income will be $35,000, and a 65% chance their income will be $45,000. We know that Jordan is Income $25,000 Utility 2,800 30,000 3,200 35,000 3,500 40,000 3,700 45,000 3,800 ☐ none of the above 0 000 risk taker (lover) because their marginal utility of income is increasing risk neutral because their marginal utility of income is constant risk averse because their marginal utility of income is decreasing risk neutral because their marginal utility of income is decreasingarrow_forward
 Human Heredity: Principles and Issues (MindTap Co...BiologyISBN:9781305251052Author:Michael CummingsPublisher:Cengage Learning
 Concepts of BiologyBiologyISBN:9781938168116Author:Samantha Fowler, Rebecca Roush, James WisePublisher:OpenStax College
 Biology (MindTap Course List)BiologyISBN:9781337392938Author:Eldra Solomon, Charles Martin, Diana W. Martin, Linda R. BergPublisher:Cengage Learning
 Human Biology (MindTap Course List)BiologyISBN:9781305112100Author:Cecie Starr, Beverly McMillanPublisher:Cengage Learning
 Biology: The Dynamic Science (MindTap Course List)BiologyISBN:9781305389892Author:Peter J. Russell, Paul E. Hertz, Beverly McMillanPublisher:Cengage Learning