
Concept explainers
Videos
Reports have found that many U.S. adults would rather live in a different type of community than the one in which they are living now. A national survey of 2,260 adults asked: “Where do you live now?” and “What do you consider to be the ideal community?” Response options were City (C), Suburb (S), Small Town (T), or Rural (R). A representative portion of this survey for a sample of 100 respondents is as follows:
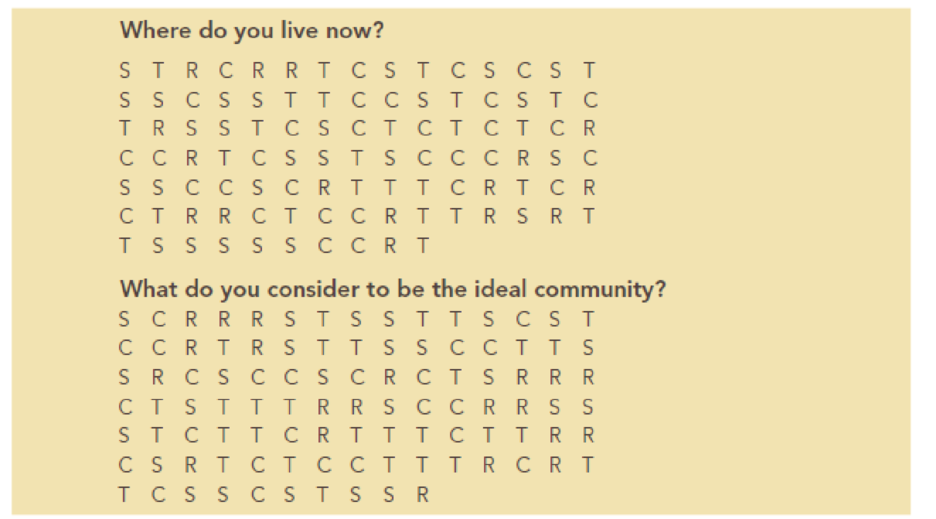
- a. Provide a percent frequency distribution and a histogram for each question.
- b. Where are most adults living now?
- c. Where do most adults consider the ideal community to be?
- d. What changes in living areas would you expect to see if people moved from where they currently live to their ideal community?
a.
Create a percent frequency distribution and histogram for each question.
Answer to Problem 8P
The percent frequency distribution for each question is as follows:
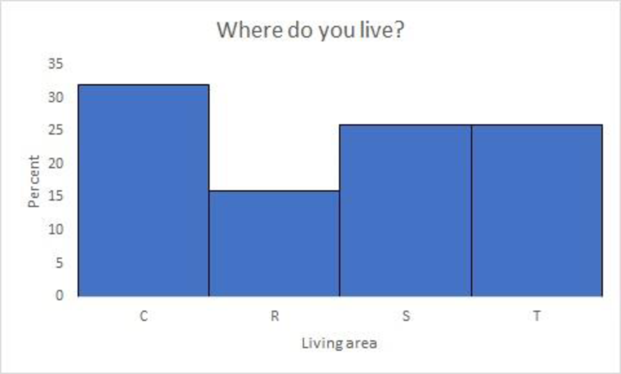
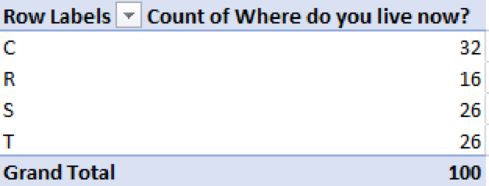
Where do you live now?
| Living area | Frequency | Percent frequency |
| C | 32 | |
| R | 16 | |
| S | 26 | |
| T | 26 |
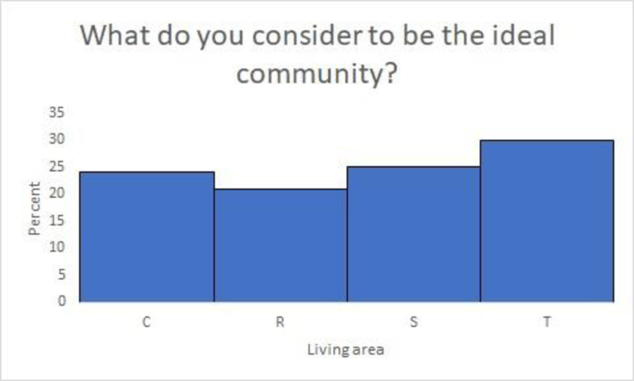
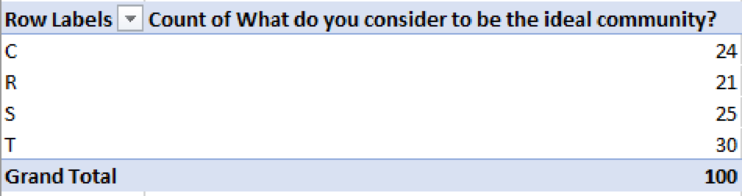
What do you consider to be the ideal community?
| Living area | Frequency | Percent frequency |
| C | 24 | |
| R | 21 | |
| S | 25 | |
| T | 30 |
The histogram for each question is as follows:
Where do you live now?
What do you consider to be the ideal community?
Explanation of Solution
Frequency distribution:
It is a table that summarizes the frequency of data values in each of several nonoverlapping bins.
Percent frequency distribution:
It is a table that summarizes the percentage of data values in each of the nonoverlapping bins.
Step-by-step procedure to obtain frequency data using EXCEL:
- Select A1:B101.
- Select Insert > PivotTable.
- Under Select a table or range, enter “$A$1:$A$101” in Table/Range.
- Click OK.
- Drag Where do you live now? to Rows.
- Drag Where do you live now? to ∑ Values.
- Click on Where do you live now? in ∑ Values.
- Select Value Field Settings.
- In Summarize value field by, choose Count and click OK.
- Now, click on Where do you live now? and Count of Where do you live now? in Drag fields between areas below and Remove Field.
- Drag What do you consider to be the ideal community? to Rows.
- Drag What do you consider to be the ideal community? to ∑ Values.
- Click on What do you consider to be the ideal community? in ∑ Values.
- Select Value Field Settings.
- In Summarize value field by, choose Count and click OK.
Outputs obtained is as follows:
The percent frequency distribution for each question is computed as follows:
Where do you live now?
| Living area | Frequency | Percent frequency |
| C | 32 | |
| R | 16 | |
| S | 26 | |
| T | 26 | |
| Total | 100 | 100 |
What do you consider to be the ideal community?
| Living area | Frequency | Percent frequency |
| C | 24 | |
| R | 21 | |
| S | 25 | |
| T | 30 | |
| Total | 100 | 100 |
Step-by-step procedure to plot histogram using EXCEL:
- Select Insert.
- Choose Insert Column or Bar Chart under Charts.
- In Series Options, enter Gap Width as 0%.
Similarly, the histogram for the other question also obtained.
Thus, the percent frequency distribution and histogram are obtained.
b.
Find the community where most adults are living now.
Answer to Problem 8P
The most adults are living in City (C).
Explanation of Solution
From Part (a), it is clear that for the question “Where do you live now?”, the percent frequency for City (C) is 32, which is highest when compared to other community.
Therefore, the most adults are living in City (C).
c.
Find the community where most adults consider the ideal community to be.
Answer to Problem 8P
The community where most adults consider the ideal community is Small Town (T).
Explanation of Solution
From Part (a), it is clear that for the question “What do you consider to be the ideal community?”, the percent frequency for Small Town (T) is 30, which is highest when compared to other community.
Therefore, the most adults are living in Small Town (T).
d.
Explain the expected changes in living areas if people moved from where they currently live to their ideal community.
Explanation of Solution
The percent frequency distribution is obtained in Part (a). The difference between the percent frequencies for ideal community and currently living community is computed as follows:
| Living area | Living now | Ideal community | Difference |
| C | 32 | 24 | |
| R | 16 | 21 | |
| S | 26 | 25 | |
| T | 26 | 30 |
It is clear that there is no substantial change in Suburb living (S). However, the difference in percent between ideal community and currently living community is high for Small Town (T) and Rural (R). Hence, it would be expected that living in City (C) would decline, whereas, living in Small Towns (T) and Rural (R) would increase.
Want to see more full solutions like this?
Chapter 2 Solutions
Essentials of Business Analytics (MindTap Course List)


- Exercise 6-6 (Algo) (LO6-3) The director of admissions at Kinzua University in Nova Scotia estimated the distribution of student admissions for the fall semester on the basis of past experience. Admissions Probability 1,100 0.5 1,400 0.4 1,300 0.1 Click here for the Excel Data File Required: What is the expected number of admissions for the fall semester? Compute the variance and the standard deviation of the number of admissions. Note: Round your standard deviation to 2 decimal places.arrow_forward1. Find the mean of the x-values (x-bar) and the mean of the y-values (y-bar) and write/label each here: 2. Label the second row in the table using proper notation; then, complete the table. In the fifth and sixth columns, show the 'products' of what you're multiplying, as well as the answers. X y x minus x-bar y minus y-bar (x minus x-bar)(y minus y-bar) (x minus x-bar)^2 xy 16 20 34 4-2 5 2 3. Write the sums that represents Sxx and Sxy in the table, at the bottom of their respective columns. 4. Find the slope of the Regression line: bi = (simplify your answer) 5. Find the y-intercept of the Regression line, and then write the equation of the Regression line. Show your work. Then, BOX your final answer. Express your line as "y-hat equals...arrow_forwardApply STATA commands & submit the output for each question only when indicated below i. Generate the log of birthweight and family income of children. Name these new variables Ibwght & Ifaminc. Include the output of this code. ii. Apply the command sum with the detail option to the variable faminc. Note: you should find the 25th percentile value, the 50th percentile and the 75th percentile value of faminc from the output - you will need it to answer the next question Include the output of this code. iii. iv. Use the output from part ii of this question to Generate a variable called "high_faminc" that takes a value 1 if faminc is less than or equal to the 25th percentile, it takes the value 2 if faminc is greater than 25th percentile but less than or equal to the 50th percentile, it takes the value 3 if faminc is greater than 50th percentile but less than or equal to the 75th percentile, it takes the value 4 if faminc is greater than the 75th percentile. Include the outcome of this code…arrow_forward
- solve this on paperarrow_forwardApply STATA commands & submit the output for each question only when indicated below i. Apply the command egen to create a variable called "wyd" which is the rowtotal function on variables bwght & faminc. ii. Apply the list command for the first 10 observations to show that the code in part i worked. Include the outcome of this code iii. Apply the egen command to create a new variable called "bwghtsum" using the sum function on variable bwght by the variable high_faminc (Note: need to apply the bysort' statement) iv. Apply the "by high_faminc" statement to find the V. descriptive statistics of bwght and bwghtsum Include the output of this code. Why is there a difference between the standard deviations of bwght and bwghtsum from part iv of this question?arrow_forwardAccording to a health information website, the distribution of adults’ diastolic blood pressure (in millimeters of mercury, mmHg) can be modeled by a normal distribution with mean 70 mmHg and standard deviation 20 mmHg. b. Above what diastolic pressure would classify someone in the highest 1% of blood pressures? Show all calculations used.arrow_forward
- Write STATA codes which will generate the outcomes in the questions & submit the output for each question only when indicated below i. ii. iii. iv. V. Write a code which will allow STATA to go to your favorite folder to access your files. Load the birthweight1.dta dataset from your favorite folder and save it under a different filename to protect data integrity. Call the new dataset babywt.dta (make sure to use the replace option). Verify that it contains 2,998 observations and 8 variables. Include the output of this code. Are there missing observations for variable(s) for the variables called bwght, faminc, cigs? How would you know? (You may use more than one code to show your answer(s)) Include the output of your code (s). Write the definitions of these variables: bwght, faminc, male, white, motheduc,cigs; which of these variables are categorical? [Hint: use the labels of the variables & the browse command] Who is this dataset about? Who can use this dataset to answer what kind of…arrow_forwardApply STATA commands & submit the output for each question only when indicated below İ. ii. iii. iv. V. Apply the command summarize on variables bwght and faminc. What is the average birthweight of babies and family income of the respondents? Include the output of this code. Apply the tab command on the variable called male. How many of the babies and what share of babies are male? Include the output of this code. Find the summary statistics (i.e. use the sum command) of the variables bwght and faminc if the babies are white. Include the output of this code. Find the summary statistics (i.e. use the sum command) of the variables bwght and faminc if the babies are male but not white. Include the output of this code. Using your answers to previous subparts of this question: What is the difference between the average birthweight of a baby who is male and a baby who is male but not white? What can you say anything about the difference in family income of the babies that are male and male…arrow_forwardA public health researcher is studying the impacts of nudge marketing techniques on shoppers vegetablesarrow_forward
- The director of admissions at Kinzua University in Nova Scotia estimated the distribution of student admissions for the fall semester on the basis of past experience. Admissions Probability 1,100 0.5 1,400 0.4 1,300 0.1 Click here for the Excel Data File Required: What is the expected number of admissions for the fall semester? Compute the variance and the standard deviation of the number of admissions. Note: Round your standard deviation to 2 decimal places.arrow_forwardA pollster randomly selected four of 10 available people. Required: How many different groups of 4 are possible? What is the probability that a person is a member of a group? Note: Round your answer to 3 decimal places.arrow_forwardWind Mountain is an archaeological study area located in southwestern New Mexico. Potsherds are broken pieces of prehistoric Native American clay vessels. One type of painted ceramic vessel is called Mimbres classic black-on-white. At three different sites the number of such sherds was counted in local dwelling excavations. Test given. Site I Site II Site III 63 19 60 43 34 21 23 49 51 48 11 15 16 46 26 20 31 Find .arrow_forward
 Big Ideas Math A Bridge To Success Algebra 1: Stu...AlgebraISBN:9781680331141Author:HOUGHTON MIFFLIN HARCOURTPublisher:Houghton Mifflin Harcourt
 Holt Mcdougal Larson Pre-algebra: Student Edition...AlgebraISBN:9780547587776Author:HOLT MCDOUGALPublisher:HOLT MCDOUGAL
 Glencoe Algebra 1, Student Edition, 9780079039897...AlgebraISBN:9780079039897Author:CarterPublisher:McGraw Hill