
Essentials of Business Analytics (MindTap Course List)
2nd Edition
ISBN: 9781305627734
Author: Jeffrey D. Camm, James J. Cochran, Michael J. Fry, Jeffrey W. Ohlmann, David R. Anderson
Publisher: Cengage Learning
expand_more
expand_more
format_list_bulleted
Concept explainers
Videos
Textbook Question
Chapter 2, Problem 19P
Suppose that the average waiting time for a patient at a physician’s office is just over 29 minutes. To address the issue of long patient wait times, some physicians’ offices are using wait-tracking systems to notify patients of expected wait times. Patients can adjust their arrival times based on this information and spend less time in waiting rooms. The following data show wait times (in minutes) for a sample of patients at offices that do not have a wait-tracking system and wait times for a sample of patients at offices with such systems.
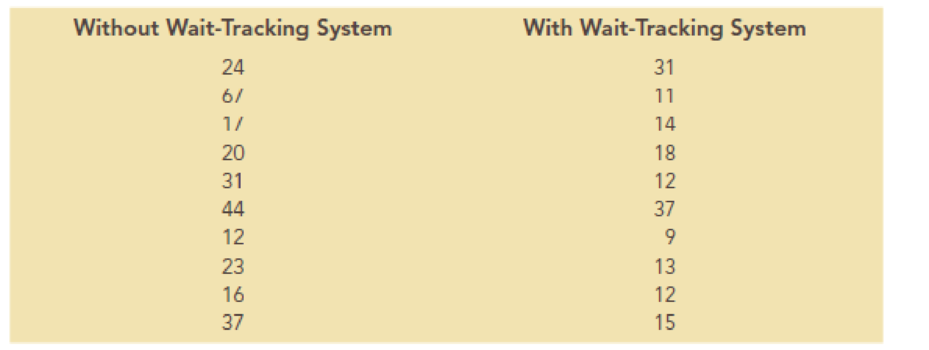
- a. What are the
mean andmedian patient wait times for offices with a wait-tracking system? What are the mean and median patient wait times for offices without a wait-tracking system? - b. What are the variance and standard deviation of patient wait times for offices with a wait-tracking system? What are the variance and standard deviation of patient wait times for visits to offices without a wait tracking system?
- c. Create a box plot for patient wait times for offices without a wait-tracking system.
- d. Create a box plot for patient wait times for offices with a wait-tracking system.
- e. Do offices with a wait-tracking system have shorter patient wait times than offices without a wait-tracking system? Explain.
Expert Solution & Answer

Trending nowThis is a popular solution!

Students have asked these similar questions
08:34
◄ Classroom
07:59
Probs. 5-32/33
D
ا.
89
5-34. Determine the horizontal and vertical components
of reaction at the pin A and the normal force at the smooth
peg B on the member.
A
0,4 m
0.4 m
Prob. 5-34
F=600 N
fr
th
ar
0.
163586
5-37. The wooden plank resting between the buildings
deflects slightly when it supports the 50-kg boy. This
deflection causes a triangular distribution of load at its ends.
having maximum intensities of w, and wg. Determine w
and wg. each measured in N/m. when the boy is standing
3 m from one end as shown. Neglect the mass of the plank.
0.45 m
3 m
Examine the Variables: Carefully review and note the names of all variables in the dataset. Examples of these variables include:
Mileage (mpg)
Number of Cylinders (cyl)
Displacement (disp)
Horsepower (hp)
Research: Google to understand these variables.
Statistical Analysis: Select mpg variable, and perform the following statistical tests. Once you are done with these tests using mpg variable, repeat the same with hp
Mean
Median
First Quartile (Q1)
Second Quartile (Q2)
Third Quartile (Q3)
Fourth Quartile (Q4)
10th Percentile
70th Percentile
Skewness
Kurtosis
Document Your Results:
In RStudio: Before running each statistical test, provide a heading in the format shown at the bottom. “# Mean of mileage – Your name’s command”
In Microsoft Word: Once you've completed all tests, take a screenshot of your results in RStudio and paste it into a Microsoft Word document. Make sure that snapshots are very clear. You will need multiple snapshots. Also transfer these results to the…
Chapter 2 Solutions
Essentials of Business Analytics (MindTap Course List)
Ch. 2 - A Wall Street Journal subscriber survey asked 46...Ch. 2 - The following table contains a partial list of...Ch. 2 - Ohio Logistics manages the logistical activities...Ch. 2 - A partial relative frequency distribution is...Ch. 2 - In a recent report, the top five most-visited...Ch. 2 - In a study of how chief executive officers (CEOs)...Ch. 2 - Consumer complaints are frequently reported to the...Ch. 2 - Reports have found that many U.S. adults would...Ch. 2 - Consider the following data: a. Develop a...Ch. 2 - Consider the following frequency distribution....
Ch. 2 - The owner of an automobile repair shop studied the...Ch. 2 - Approximately 1.65 million high school students...Ch. 2 - Consider a sample with data values of 10, 20, 12,...Ch. 2 - Consider a sample with data values of 27, 25, 20,...Ch. 2 - Consider a sample with data values of 53, 55, 70,...Ch. 2 - If an asset declines in value from 5,000 to 3,500...Ch. 2 - Suppose that you initially invested 10,000 in the...Ch. 2 - The average time that Americans commute to work is...Ch. 2 - Suppose that the average waiting time for a...Ch. 2 - According to the National Education Association...Ch. 2 - Return to the waiting times given for the...Ch. 2 - The results of a national survey showed that on...Ch. 2 - Suppose that the national average for the math...Ch. 2 - Five observations taken for two variables follow....Ch. 2 - The scatter chart in the following figure was...Ch. 2 - The economic downturn in 20082009 resulted in the...Ch. 2 - Heavenly Chocolates manufactures and sells quality...
Knowledge Booster


Learn more about
Need a deep-dive on the concept behind this application? Look no further. Learn more about this topic, statistics and related others by exploring similar questions and additional content below.Similar questions
- Examine the Variables: Carefully review and note the names of all variables in the dataset. Examples of these variables include: Mileage (mpg) Number of Cylinders (cyl) Displacement (disp) Horsepower (hp) Research: Google to understand these variables. Statistical Analysis: Select mpg variable, and perform the following statistical tests. Once you are done with these tests using mpg variable, repeat the same with hp Mean Median First Quartile (Q1) Second Quartile (Q2) Third Quartile (Q3) Fourth Quartile (Q4) 10th Percentile 70th Percentile Skewness Kurtosis Document Your Results: In RStudio: Before running each statistical test, provide a heading in the format shown at the bottom. “# Mean of mileage – Your name’s command” In Microsoft Word: Once you've completed all tests, take a screenshot of your results in RStudio and paste it into a Microsoft Word document. Make sure that snapshots are very clear. You will need multiple snapshots. Also transfer these results to the…arrow_forward2 (VaR and ES) Suppose X1 are independent. Prove that ~ Unif[-0.5, 0.5] and X2 VaRa (X1X2) < VaRa(X1) + VaRa (X2). ~ Unif[-0.5, 0.5]arrow_forward8 (Correlation and Diversification) Assume we have two stocks, A and B, show that a particular combination of the two stocks produce a risk-free portfolio when the correlation between the return of A and B is -1.arrow_forward
- 9 (Portfolio allocation) Suppose R₁ and R2 are returns of 2 assets and with expected return and variance respectively r₁ and 72 and variance-covariance σ2, 0%½ and σ12. Find −∞ ≤ w ≤ ∞ such that the portfolio wR₁ + (1 - w) R₂ has the smallest risk.arrow_forward7 (Multivariate random variable) Suppose X, €1, €2, €3 are IID N(0, 1) and Y2 Y₁ = 0.2 0.8X + €1, Y₂ = 0.3 +0.7X+ €2, Y3 = 0.2 + 0.9X + €3. = (In models like this, X is called the common factors of Y₁, Y₂, Y3.) Y = (Y1, Y2, Y3). (a) Find E(Y) and cov(Y). (b) What can you observe from cov(Y). Writearrow_forward1 (VaR and ES) Suppose X ~ f(x) with 1+x, if 0> x > −1 f(x) = 1−x if 1 x > 0 Find VaRo.05 (X) and ES0.05 (X).arrow_forward
- Joy is making Christmas gifts. She has 6 1/12 feet of yarn and will need 4 1/4 to complete our project. How much yarn will she have left over compute this solution in two different ways arrow_forwardSolve for X. Explain each step. 2^2x • 2^-4=8arrow_forwardOne hundred people were surveyed, and one question pertained to their educational background. The results of this question and their genders are given in the following table. Female (F) Male (F′) Total College degree (D) 30 20 50 No college degree (D′) 30 20 50 Total 60 40 100 If a person is selected at random from those surveyed, find the probability of each of the following events.1. The person is female or has a college degree. Answer: equation editor Equation Editor 2. The person is male or does not have a college degree. Answer: equation editor Equation Editor 3. The person is female or does not have a college degree.arrow_forward
arrow_back_ios
SEE MORE QUESTIONS
arrow_forward_ios
Recommended textbooks for you
 Glencoe Algebra 1, Student Edition, 9780079039897...AlgebraISBN:9780079039897Author:CarterPublisher:McGraw Hill
 Big Ideas Math A Bridge To Success Algebra 1: Stu...AlgebraISBN:9781680331141Author:HOUGHTON MIFFLIN HARCOURTPublisher:Houghton Mifflin Harcourt
 College Algebra (MindTap Course List)AlgebraISBN:9781305652231Author:R. David Gustafson, Jeff HughesPublisher:Cengage Learning
 Holt Mcdougal Larson Pre-algebra: Student Edition...AlgebraISBN:9780547587776Author:HOLT MCDOUGALPublisher:HOLT MCDOUGAL
Glencoe Algebra 1, Student Edition, 9780079039897...
Algebra
ISBN:9780079039897
Author:Carter
Publisher:McGraw Hill
Big Ideas Math A Bridge To Success Algebra 1: Stu...
Algebra
ISBN:9781680331141
Author:HOUGHTON MIFFLIN HARCOURT
Publisher:Houghton Mifflin Harcourt
College Algebra (MindTap Course List)
Algebra
ISBN:9781305652231
Author:R. David Gustafson, Jeff Hughes
Publisher:Cengage Learning
Holt Mcdougal Larson Pre-algebra: Student Edition...
Algebra
ISBN:9780547587776
Author:HOLT MCDOUGAL
Publisher:HOLT MCDOUGAL
Mod-01 Lec-01 Discrete probability distributions (Part 1); Author: nptelhrd;https://www.youtube.com/watch?v=6x1pL9Yov1k;License: Standard YouTube License, CC-BY
Discrete Probability Distributions; Author: Learn Something;https://www.youtube.com/watch?v=m9U4UelWLFs;License: Standard YouTube License, CC-BY
Probability Distribution Functions (PMF, PDF, CDF); Author: zedstatistics;https://www.youtube.com/watch?v=YXLVjCKVP7U;License: Standard YouTube License, CC-BY
Discrete Distributions: Binomial, Poisson and Hypergeometric | Statistics for Data Science; Author: Dr. Bharatendra Rai;https://www.youtube.com/watch?v=lHhyy4JMigg;License: Standard Youtube License