
Essentials of Business Analytics (MindTap Course List)
2nd Edition
ISBN: 9781305627734
Author: Jeffrey D. Camm, James J. Cochran, Michael J. Fry, Jeffrey W. Ohlmann, David R. Anderson
Publisher: Cengage Learning
expand_more
expand_more
format_list_bulleted
Concept explainers
Videos
Textbook Question
Chapter 2, Problem 25P
The scatter chart in the following figure was created using sample data for profits and market capitalizations from a sample of firms in the Fortune 500.
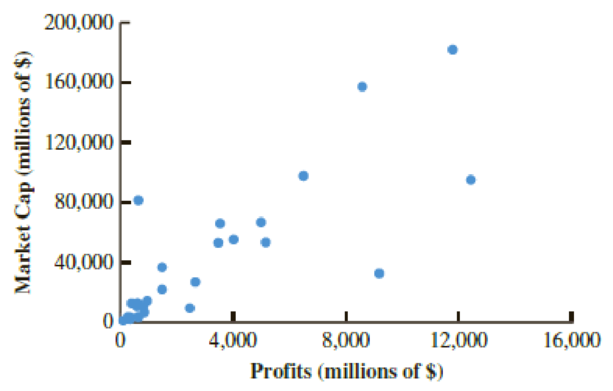
- a. Discuss what the scatter chart indicates about the relationship between profits and market capitalization?
- b. The data used to produce this are contained in the file Fortune500. Calculate the
covariance between profits and market capitalization. Discuss what the covariance indicates about the relationship between profits and market capitalization? - c. Calculate the
correlation coefficient between profits and market capitalization. What does thecorrelations coefficient indicate about the relationship between profits and market capitalization?
Expert Solution & Answer

Trending nowThis is a popular solution!

Students have asked these similar questions
There are four white, fourteen blue and five green marbles in a bag. A marble is selected from the bag without looking. Find the odds of the following:
The odds against selecting a green marble.
The odds in favour of not selecting a green marble
The odds in favor of the marble selected being either a white or a blue marble.
What is true about the above odds? Explain
Please show as much work as possible to clearly show the steps you used to find each solution. If you plan to use a calculator, please be sure to clearly indicate your strategy.
1. The probability of a soccer game in a particular league going into overtime is 0.125. Find the following:
a. The odds in favour of a game going into overtime.
b. The odds in favour of a game not going into overtime.
c. If the teams in the league play 100 games in a season, about how many games would you expect to go into overtime?
explain the importance of the Hypothesis test in a business setting, and give an example of a situation where it is helpful in business decision making.
Chapter 2 Solutions
Essentials of Business Analytics (MindTap Course List)
Ch. 2 - A Wall Street Journal subscriber survey asked 46...Ch. 2 - The following table contains a partial list of...Ch. 2 - Ohio Logistics manages the logistical activities...Ch. 2 - A partial relative frequency distribution is...Ch. 2 - In a recent report, the top five most-visited...Ch. 2 - In a study of how chief executive officers (CEOs)...Ch. 2 - Consumer complaints are frequently reported to the...Ch. 2 - Reports have found that many U.S. adults would...Ch. 2 - Consider the following data: a. Develop a...Ch. 2 - Consider the following frequency distribution....
Ch. 2 - The owner of an automobile repair shop studied the...Ch. 2 - Approximately 1.65 million high school students...Ch. 2 - Consider a sample with data values of 10, 20, 12,...Ch. 2 - Consider a sample with data values of 27, 25, 20,...Ch. 2 - Consider a sample with data values of 53, 55, 70,...Ch. 2 - If an asset declines in value from 5,000 to 3,500...Ch. 2 - Suppose that you initially invested 10,000 in the...Ch. 2 - The average time that Americans commute to work is...Ch. 2 - Suppose that the average waiting time for a...Ch. 2 - According to the National Education Association...Ch. 2 - Return to the waiting times given for the...Ch. 2 - The results of a national survey showed that on...Ch. 2 - Suppose that the national average for the math...Ch. 2 - Five observations taken for two variables follow....Ch. 2 - The scatter chart in the following figure was...Ch. 2 - The economic downturn in 20082009 resulted in the...Ch. 2 - Heavenly Chocolates manufactures and sells quality...
Knowledge Booster


Learn more about
Need a deep-dive on the concept behind this application? Look no further. Learn more about this topic, statistics and related others by exploring similar questions and additional content below.Similar questions
- A college wants to estimate what students typically spend on textbooks. A report fromthe college bookstore observes that textbooks range in price from $22 to $186. Toobtain a 95% confidence level for a confidence interval estimate to plus or minus $10,how many students should the college survey? (We may estimate the populationstandard deviation as (range) ÷ 4.)arrow_forwardIn a study of how students give directions, forty volunteers were given the task ofexplaining to another person how to reach a destination. Researchers measured thefollowing five aspects of the subjects’ direction-giving behavior:• whether a map was available or if directions were given from memory without a map,• the gender of the direction-giver,• the distances given as part of the directions,• the number of times directions such as “north” or “left” were used,• the frequency of errors in directions. Identify each of the variables in this study, and whether each is quantitative orqualitative. For each quantitative variable, state whether it is discrete or continuous. Was this an observational study or an experimental study? Explain your answer.arrow_forwardexplain the difference between the confident interval and the confident level. provide an example to show how to correctly interpret a confidence interval.arrow_forward
- Sketch to scale the orbit of Earth about the sun. Graph Icarus’ orbit on the same set of axesWhile the sun is the center of Earth’s orbit, it is a focus of Icarus’ orbit. There aretwo points of intersection on the graph. Based on the graph, what is the approximate distance between the two points of intersection (in AU)?arrow_forwardThe diameters of ball bearings are distributed normally. The mean diameter is 67 millimeters and the standard deviation is 3 millimeters. Find the probability that the diameter of a selected bearing is greater than 63 millimeters. Round to four decimal places.arrow_forwardSuppose you like to keep a jar of change on your desk. Currently, the jar contains the following: 22 Pennies 27 Dimes 9 Nickels 30 Quarters What is the probability that you reach into the jar and randomly grab a penny and then, without replacement, a dime? Express as a fraction or a decimal number rounded to four decimal places.arrow_forward
- A box contains 14 large marbles and 10 small marbles. Each marble is either green or white. 9 of the large marbles are green, and 4 of the small marbles are white. If a marble is randomly selected from the box, what is the probability that it is small or white? Express as a fraction or a decimal number rounded to four decimal places.arrow_forwardCan I get help with this step please? At a shooting range, instructors can determine if a shooter is consistently missing the target because of the gun sight or because of the shooter's ability. If a gun's sight is off, the variance of the distances between the shots and the center of the shot pattern will be small (even if the shots are not in the center of the target). A student claims that it is the sight that is off, not his aim, and wants the instructor to confirm his claim. If a skilled shooter fires a gun at a target multiple times, the distances between the shots and the center of the shot pattern, measured in centimeters (cm), will have a variance of less than 0.33. After the student shoots 28 shots at the target, the instructor calculates that the distances between his shots and the center of the shot pattern, measured in cm, have a variance of 0.25. Does this evidence support the student's claim that the gun's sight is off? Use a 0.025 level of significance. Assume that the…arrow_forwardThe National Academy of Science reported that 38% of research in mathematics is published by US authors. The mathematics chairperson of a prestigious university wishes to test the claim that this percentage is no longer 38%. He has no indication of whether the percentage has increased or decreased since that time. He surveys a simple random sample of 279 recent articles published by reputable mathematics research journals and finds that 123 of these articles have US authors. Does this evidence support the mathematics chairperson's claim that the percentage is no longer 38 % ? Use a 0.02 level of significance. Compute the value of the test statistic. Round to two decimal places.arrow_forward
- A marketing research company desires to know the mean consumption of milk per week among males over age 32. They believe that the milk consumption has a mean of 4 liters, and want to construct a 98% confidence interval with a maximum error of 0.07 liters. Assuming a variance of 0.64 liters, what is the minimum number of males over age 32 they must include in their sample? Round up to the next integer.arrow_forwardSuppose GRE Verbal scores are normally distributed with a mean of 461 and a standard deviation of 118. A university plans to recruit students whose scores are in the top 4 % . What is the minimum score required for recruitment? Round to the nearest whole number, if necessaryarrow_forwardNeed help with my homework thank you random sample of 6 fields of durum wheat has a mean yield of 45.5 bushels per acre and standard deviation of 7.43 bushels per acre. Determine the 80 % confidence interval for the true mean yield. Assume the population is approximately normal. Step 1: Find the critical value that should be used in constructing the confidence interval. Round to three decimal places. Step 2 of 2: Construct the 80% confidence interval. Round to one decimal place. I got 1.476 as my critical value and 41.0 and 49.9 as my confidence intervalarrow_forward
arrow_back_ios
SEE MORE QUESTIONS
arrow_forward_ios
Recommended textbooks for you
 Glencoe Algebra 1, Student Edition, 9780079039897...AlgebraISBN:9780079039897Author:CarterPublisher:McGraw Hill
 Big Ideas Math A Bridge To Success Algebra 1: Stu...AlgebraISBN:9781680331141Author:HOUGHTON MIFFLIN HARCOURTPublisher:Houghton Mifflin Harcourt
 Holt Mcdougal Larson Pre-algebra: Student Edition...AlgebraISBN:9780547587776Author:HOLT MCDOUGALPublisher:HOLT MCDOUGAL
Glencoe Algebra 1, Student Edition, 9780079039897...
Algebra
ISBN:9780079039897
Author:Carter
Publisher:McGraw Hill
Big Ideas Math A Bridge To Success Algebra 1: Stu...
Algebra
ISBN:9781680331141
Author:HOUGHTON MIFFLIN HARCOURT
Publisher:Houghton Mifflin Harcourt
Holt Mcdougal Larson Pre-algebra: Student Edition...
Algebra
ISBN:9780547587776
Author:HOLT MCDOUGAL
Publisher:HOLT MCDOUGAL
The Shape of Data: Distributions: Crash Course Statistics #7; Author: CrashCourse;https://www.youtube.com/watch?v=bPFNxD3Yg6U;License: Standard YouTube License, CC-BY
Shape, Center, and Spread - Module 20.2 (Part 1); Author: Mrmathblog;https://www.youtube.com/watch?v=COaid7O_Gag;License: Standard YouTube License, CC-BY
Shape, Center and Spread; Author: Emily Murdock;https://www.youtube.com/watch?v=_YyW0DSCzpM;License: Standard Youtube License