
Basic Business Statistics, Student Value Edition (13th Edition)
13th Edition
ISBN: 9780321946393
Author: Mark L. Berenson, David M. Levine, Kathryn A. Szabat
Publisher: PEARSON
expand_more
expand_more
format_list_bulleted
Concept explainers
Videos
Textbook Question
Chapter 2, Problem 81PS
The following table represents the market share (in number of movies, gross in millions of dollars, and millions of tickets sold) of each type of movie in 2012:
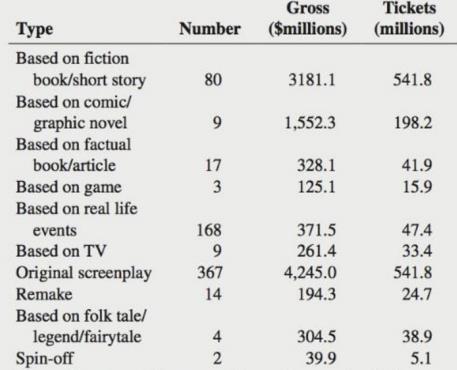
a. Construct a bar chart, a pie chart, and a Pareto chart for the number of movies, gross
b. What conclusions can you reach about the market shares of the different types of movies in 2012?
Expert Solution & Answer
Want to see the full answer?
Check out a sample textbook solution
Students have asked these similar questions
You may need to use the appropriate appendix table or technology to answer this question.
You are given the following information obtained from a random sample of 4 observations.
24
48
31
57
You want to determine whether or not the mean of the population from which this sample was taken is significantly different from 49. (Assume the population is normally distributed.)
(a)
State the null and the alternative hypotheses. (Enter != for ≠ as needed.)
H0:
Ha:
(b)
Determine the test statistic. (Round your answer to three decimal places.)
(c)
Determine the p-value, and at the 5% level of significance, test to determine whether or not the mean of the population is significantly different from 49.
Find the p-value. (Round your answer to four decimal places.)
p-value =
State your conclusion.
Reject H0. There is insufficient evidence to conclude that the mean of the population is different from 49.Do not reject H0. There is sufficient evidence to conclude that the…
65% of all violent felons in the prison system are repeat offenders. If 43 violent felons are randomly selected, find the probability that
a. Exactly 28 of them are repeat offenders.
b. At most 28 of them are repeat offenders. c. At least 28 of them are repeat offenders. d. Between 22 and 26 (including 22 and 26) of them are repeat offenders.
08:34
◄ Classroom
07:59
Probs. 5-32/33
D
ا.
89
5-34. Determine the horizontal and vertical components
of reaction at the pin A and the normal force at the smooth
peg B on the member.
A
0,4 m
0.4 m
Prob. 5-34
F=600 N
fr
th
ar
0.
163586
5-37. The wooden plank resting between the buildings
deflects slightly when it supports the 50-kg boy. This
deflection causes a triangular distribution of load at its ends.
having maximum intensities of w, and wg. Determine w
and wg. each measured in N/m. when the boy is standing
3 m from one end as shown. Neglect the mass of the plank.
0.45 m
3 m
Chapter 2 Solutions
Basic Business Statistics, Student Value Edition (13th Edition)
Ch. 2 - A categorical variable has three categories, with...Ch. 2 - The following data represent the responses to two...Ch. 2 - The following table, stored in smartphone sales,...Ch. 2 - The Edmunds.com NHTSA Complaints Activity Report...Ch. 2 - The 2013 Mortimer Spinks and Computer Weekly...Ch. 2 - The following table represents world oil...Ch. 2 - Visier’s Survey of Employers explores how North...Ch. 2 - A survey of 1,085 adults asked “Do you enjoy...Ch. 2 - Prob. 9PSCh. 2 - Do special recommendations increase ad...
Ch. 2 - Construct an ordered array, given the following...Ch. 2 - Construct an ordered array, given the following...Ch. 2 - Prob. 13PSCh. 2 - Prob. 14PSCh. 2 - Prob. 15PSCh. 2 - The file Utility contains the following data about...Ch. 2 - How much time do commuters living in or near...Ch. 2 - How do the average credit scores of people living...Ch. 2 - One operation of a mill is to cut pieces of steel...Ch. 2 - Prob. 20PSCh. 2 - Prob. 21PSCh. 2 - Prob. 22PSCh. 2 - The file Drink Contains the following data for the...Ch. 2 - Prob. 24PSCh. 2 - Prob. 25PSCh. 2 - Prob. 26PSCh. 2 - Prob. 27PSCh. 2 - Prob. 28PSCh. 2 - Prob. 29PSCh. 2 - Prob. 30PSCh. 2 - Prob. 31PSCh. 2 - Do special recommendations increase ad...Ch. 2 - Construct a stern-and-leaf display, given the...Ch. 2 - Construct an ordered array, given the following...Ch. 2 - The following is a stern-and0-leaf display...Ch. 2 - Prob. 36PSCh. 2 - The file MobileSpeed contains the overall download...Ch. 2 - The file Utility contains the following data about...Ch. 2 - Prob. 39PSCh. 2 - Prob. 40PSCh. 2 - How much time do Americans living in or near...Ch. 2 - How do the average credit scores of people living...Ch. 2 - One operation of a mill is to cut pieces of steel...Ch. 2 - Prob. 44PSCh. 2 - Prob. 45PSCh. 2 - Prob. 46PSCh. 2 - The data stored in Drink represents the amount of...Ch. 2 - The following is a set of data from a sample of...Ch. 2 - Prob. 49PSCh. 2 - Movie companies need to predict the gross receipts...Ch. 2 - Data were collected on the typical cost of dining...Ch. 2 - Prob. 52PSCh. 2 - Prob. 53PSCh. 2 - How have stocks performed in the past? The...Ch. 2 - Prob. 55PSCh. 2 - Prob. 56PSCh. 2 - The file Audits contains the number of audits of...Ch. 2 - Prob. 58PSCh. 2 - Prob. 59PSCh. 2 - Prob. 60PSCh. 2 - Using the sample of retirement funds stored in...Ch. 2 - Prob. 65PSCh. 2 - Prob. 66PSCh. 2 - Examine the following visualization, adapted from...Ch. 2 - Prob. 69PSCh. 2 - Prob. 70PSCh. 2 - How do histograms and polygons differ in...Ch. 2 - Why would you construct a summary table?Ch. 2 - What are the advantages and disadvantage of using...Ch. 2 - Compare and contrast the bar chart for categorical...Ch. 2 - What is the difference between a time-series plot...Ch. 2 - Why is it said that the main feature of a Pareto...Ch. 2 - What are the three different ways to break down...Ch. 2 - How can a multidimensional table differ from a...Ch. 2 - What type of insights can you gain from a...Ch. 2 - The following summary, table, presents the...Ch. 2 - The following table represents the market share...Ch. 2 - Prob. 82PSCh. 2 - The owner of a restaurant that services...Ch. 2 - Prob. 84PSCh. 2 - The following data represents the pounds per...Ch. 2 - Prob. 86PSCh. 2 - One of the major measures of the quality of...Ch. 2 - Prob. 88PSCh. 2 - Prob. 89PSCh. 2 - Prob. 90PSCh. 2 - Prob. 91PSCh. 2 - Prob. 92PSCh. 2 - What was the average price of a room at two-star,...Ch. 2 - The file Protein contains calorie and cholesterol...Ch. 2 - The file Natural Gas contains the U.S. monthly...Ch. 2 - Prob. 96PSCh. 2 - Prob. 97PSCh. 2 - A/B testing allows business to test a new design...
Knowledge Booster


Learn more about
Need a deep-dive on the concept behind this application? Look no further. Learn more about this topic, statistics and related others by exploring similar questions and additional content below.Similar questions
- Examine the Variables: Carefully review and note the names of all variables in the dataset. Examples of these variables include: Mileage (mpg) Number of Cylinders (cyl) Displacement (disp) Horsepower (hp) Research: Google to understand these variables. Statistical Analysis: Select mpg variable, and perform the following statistical tests. Once you are done with these tests using mpg variable, repeat the same with hp Mean Median First Quartile (Q1) Second Quartile (Q2) Third Quartile (Q3) Fourth Quartile (Q4) 10th Percentile 70th Percentile Skewness Kurtosis Document Your Results: In RStudio: Before running each statistical test, provide a heading in the format shown at the bottom. “# Mean of mileage – Your name’s command” In Microsoft Word: Once you've completed all tests, take a screenshot of your results in RStudio and paste it into a Microsoft Word document. Make sure that snapshots are very clear. You will need multiple snapshots. Also transfer these results to the…arrow_forwardExamine the Variables: Carefully review and note the names of all variables in the dataset. Examples of these variables include: Mileage (mpg) Number of Cylinders (cyl) Displacement (disp) Horsepower (hp) Research: Google to understand these variables. Statistical Analysis: Select mpg variable, and perform the following statistical tests. Once you are done with these tests using mpg variable, repeat the same with hp Mean Median First Quartile (Q1) Second Quartile (Q2) Third Quartile (Q3) Fourth Quartile (Q4) 10th Percentile 70th Percentile Skewness Kurtosis Document Your Results: In RStudio: Before running each statistical test, provide a heading in the format shown at the bottom. “# Mean of mileage – Your name’s command” In Microsoft Word: Once you've completed all tests, take a screenshot of your results in RStudio and paste it into a Microsoft Word document. Make sure that snapshots are very clear. You will need multiple snapshots. Also transfer these results to the…arrow_forwardExamine the Variables: Carefully review and note the names of all variables in the dataset. Examples of these variables include: Mileage (mpg) Number of Cylinders (cyl) Displacement (disp) Horsepower (hp) Research: Google to understand these variables. Statistical Analysis: Select mpg variable, and perform the following statistical tests. Once you are done with these tests using mpg variable, repeat the same with hp Mean Median First Quartile (Q1) Second Quartile (Q2) Third Quartile (Q3) Fourth Quartile (Q4) 10th Percentile 70th Percentile Skewness Kurtosis Document Your Results: In RStudio: Before running each statistical test, provide a heading in the format shown at the bottom. “# Mean of mileage – Your name’s command” In Microsoft Word: Once you've completed all tests, take a screenshot of your results in RStudio and paste it into a Microsoft Word document. Make sure that snapshots are very clear. You will need multiple snapshots. Also transfer these results to the…arrow_forward
- 2 (VaR and ES) Suppose X1 are independent. Prove that ~ Unif[-0.5, 0.5] and X2 VaRa (X1X2) < VaRa(X1) + VaRa (X2). ~ Unif[-0.5, 0.5]arrow_forward8 (Correlation and Diversification) Assume we have two stocks, A and B, show that a particular combination of the two stocks produce a risk-free portfolio when the correlation between the return of A and B is -1.arrow_forward9 (Portfolio allocation) Suppose R₁ and R2 are returns of 2 assets and with expected return and variance respectively r₁ and 72 and variance-covariance σ2, 0%½ and σ12. Find −∞ ≤ w ≤ ∞ such that the portfolio wR₁ + (1 - w) R₂ has the smallest risk.arrow_forward
- 7 (Multivariate random variable) Suppose X, €1, €2, €3 are IID N(0, 1) and Y2 Y₁ = 0.2 0.8X + €1, Y₂ = 0.3 +0.7X+ €2, Y3 = 0.2 + 0.9X + €3. = (In models like this, X is called the common factors of Y₁, Y₂, Y3.) Y = (Y1, Y2, Y3). (a) Find E(Y) and cov(Y). (b) What can you observe from cov(Y). Writearrow_forward1 (VaR and ES) Suppose X ~ f(x) with 1+x, if 0> x > −1 f(x) = 1−x if 1 x > 0 Find VaRo.05 (X) and ES0.05 (X).arrow_forwardJoy is making Christmas gifts. She has 6 1/12 feet of yarn and will need 4 1/4 to complete our project. How much yarn will she have left over compute this solution in two different ways arrow_forward
- Solve for X. Explain each step. 2^2x • 2^-4=8arrow_forwardOne hundred people were surveyed, and one question pertained to their educational background. The results of this question and their genders are given in the following table. Female (F) Male (F′) Total College degree (D) 30 20 50 No college degree (D′) 30 20 50 Total 60 40 100 If a person is selected at random from those surveyed, find the probability of each of the following events.1. The person is female or has a college degree. Answer: equation editor Equation Editor 2. The person is male or does not have a college degree. Answer: equation editor Equation Editor 3. The person is female or does not have a college degree.arrow_forwardneed help with part barrow_forward
arrow_back_ios
SEE MORE QUESTIONS
arrow_forward_ios
Recommended textbooks for you
 Glencoe Algebra 1, Student Edition, 9780079039897...AlgebraISBN:9780079039897Author:CarterPublisher:McGraw Hill
 Big Ideas Math A Bridge To Success Algebra 1: Stu...AlgebraISBN:9781680331141Author:HOUGHTON MIFFLIN HARCOURTPublisher:Houghton Mifflin Harcourt
 Holt Mcdougal Larson Pre-algebra: Student Edition...AlgebraISBN:9780547587776Author:HOLT MCDOUGALPublisher:HOLT MCDOUGAL
Glencoe Algebra 1, Student Edition, 9780079039897...
Algebra
ISBN:9780079039897
Author:Carter
Publisher:McGraw Hill
Big Ideas Math A Bridge To Success Algebra 1: Stu...
Algebra
ISBN:9781680331141
Author:HOUGHTON MIFFLIN HARCOURT
Publisher:Houghton Mifflin Harcourt
Holt Mcdougal Larson Pre-algebra: Student Edition...
Algebra
ISBN:9780547587776
Author:HOLT MCDOUGAL
Publisher:HOLT MCDOUGAL
Statistics 4.1 Point Estimators; Author: Dr. Jack L. Jackson II;https://www.youtube.com/watch?v=2MrI0J8XCEE;License: Standard YouTube License, CC-BY
Statistics 101: Point Estimators; Author: Brandon Foltz;https://www.youtube.com/watch?v=4v41z3HwLaM;License: Standard YouTube License, CC-BY
Central limit theorem; Author: 365 Data Science;https://www.youtube.com/watch?v=b5xQmk9veZ4;License: Standard YouTube License, CC-BY
Point Estimate Definition & Example; Author: Prof. Essa;https://www.youtube.com/watch?v=OTVwtvQmSn0;License: Standard Youtube License
Point Estimation; Author: Vamsidhar Ambatipudi;https://www.youtube.com/watch?v=flqhlM2bZWc;License: Standard Youtube License