
Basic Business Statistics, Student Value Edition (13th Edition)
13th Edition
ISBN: 9780321946393
Author: Mark L. Berenson, David M. Levine, Kathryn A. Szabat
Publisher: PEARSON
expand_more
expand_more
format_list_bulleted
Videos
Textbook Question
Chapter 2, Problem 67PS
Examine the following visualization, adapted from a management consulting while paper.
When manages believe they will need to make major changes to their IT infrastructure to combat resource scarcity
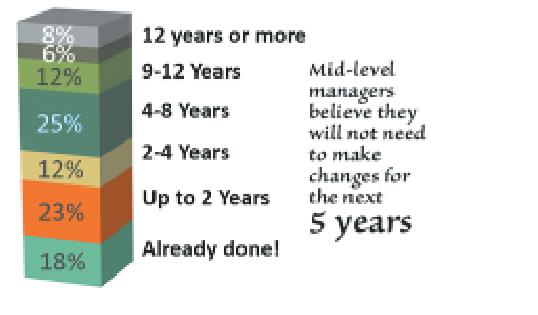
a. Describe at least one good feature of this visual display.
b. Describe at least one bad feature of this visual display.
c. Redraw the graph, by using the Exhibit 2.1 guidelines.
Expert Solution & Answer
Want to see the full answer?
Check out a sample textbook solution
Students have asked these similar questions
Show all work
Show all work
Show all work
Chapter 2 Solutions
Basic Business Statistics, Student Value Edition (13th Edition)
Ch. 2 - A categorical variable has three categories, with...Ch. 2 - The following data represent the responses to two...Ch. 2 - The following table, stored in smartphone sales,...Ch. 2 - The Edmunds.com NHTSA Complaints Activity Report...Ch. 2 - The 2013 Mortimer Spinks and Computer Weekly...Ch. 2 - The following table represents world oil...Ch. 2 - Visier’s Survey of Employers explores how North...Ch. 2 - A survey of 1,085 adults asked “Do you enjoy...Ch. 2 - Prob. 9PSCh. 2 - Do special recommendations increase ad...
Ch. 2 - Construct an ordered array, given the following...Ch. 2 - Construct an ordered array, given the following...Ch. 2 - Prob. 13PSCh. 2 - Prob. 14PSCh. 2 - Prob. 15PSCh. 2 - The file Utility contains the following data about...Ch. 2 - How much time do commuters living in or near...Ch. 2 - How do the average credit scores of people living...Ch. 2 - One operation of a mill is to cut pieces of steel...Ch. 2 - Prob. 20PSCh. 2 - Prob. 21PSCh. 2 - Prob. 22PSCh. 2 - The file Drink Contains the following data for the...Ch. 2 - Prob. 24PSCh. 2 - Prob. 25PSCh. 2 - Prob. 26PSCh. 2 - Prob. 27PSCh. 2 - Prob. 28PSCh. 2 - Prob. 29PSCh. 2 - Prob. 30PSCh. 2 - Prob. 31PSCh. 2 - Do special recommendations increase ad...Ch. 2 - Construct a stern-and-leaf display, given the...Ch. 2 - Construct an ordered array, given the following...Ch. 2 - The following is a stern-and0-leaf display...Ch. 2 - Prob. 36PSCh. 2 - The file MobileSpeed contains the overall download...Ch. 2 - The file Utility contains the following data about...Ch. 2 - Prob. 39PSCh. 2 - Prob. 40PSCh. 2 - How much time do Americans living in or near...Ch. 2 - How do the average credit scores of people living...Ch. 2 - One operation of a mill is to cut pieces of steel...Ch. 2 - Prob. 44PSCh. 2 - Prob. 45PSCh. 2 - Prob. 46PSCh. 2 - The data stored in Drink represents the amount of...Ch. 2 - The following is a set of data from a sample of...Ch. 2 - Prob. 49PSCh. 2 - Movie companies need to predict the gross receipts...Ch. 2 - Data were collected on the typical cost of dining...Ch. 2 - Prob. 52PSCh. 2 - Prob. 53PSCh. 2 - How have stocks performed in the past? The...Ch. 2 - Prob. 55PSCh. 2 - Prob. 56PSCh. 2 - The file Audits contains the number of audits of...Ch. 2 - Prob. 58PSCh. 2 - Prob. 59PSCh. 2 - Prob. 60PSCh. 2 - Using the sample of retirement funds stored in...Ch. 2 - Prob. 65PSCh. 2 - Prob. 66PSCh. 2 - Examine the following visualization, adapted from...Ch. 2 - Prob. 69PSCh. 2 - Prob. 70PSCh. 2 - How do histograms and polygons differ in...Ch. 2 - Why would you construct a summary table?Ch. 2 - What are the advantages and disadvantage of using...Ch. 2 - Compare and contrast the bar chart for categorical...Ch. 2 - What is the difference between a time-series plot...Ch. 2 - Why is it said that the main feature of a Pareto...Ch. 2 - What are the three different ways to break down...Ch. 2 - How can a multidimensional table differ from a...Ch. 2 - What type of insights can you gain from a...Ch. 2 - The following summary, table, presents the...Ch. 2 - The following table represents the market share...Ch. 2 - Prob. 82PSCh. 2 - The owner of a restaurant that services...Ch. 2 - Prob. 84PSCh. 2 - The following data represents the pounds per...Ch. 2 - Prob. 86PSCh. 2 - One of the major measures of the quality of...Ch. 2 - Prob. 88PSCh. 2 - Prob. 89PSCh. 2 - Prob. 90PSCh. 2 - Prob. 91PSCh. 2 - Prob. 92PSCh. 2 - What was the average price of a room at two-star,...Ch. 2 - The file Protein contains calorie and cholesterol...Ch. 2 - The file Natural Gas contains the U.S. monthly...Ch. 2 - Prob. 96PSCh. 2 - Prob. 97PSCh. 2 - A/B testing allows business to test a new design...
Knowledge Booster


Learn more about
Need a deep-dive on the concept behind this application? Look no further. Learn more about this topic, statistics and related others by exploring similar questions and additional content below.Similar questions
- A marketing agency wants to determine whether different advertising platforms generate significantly different levels of customer engagement. The agency measures the average number of daily clicks on ads for three platforms: Social Media, Search Engines, and Email Campaigns. The agency collects data on daily clicks for each platform over a 10-day period and wants to test whether there is a statistically significant difference in the mean number of daily clicks among these platforms. Conduct ANOVA test. You can provide your answer by inserting a text box and the answer must include: also please provide a step by on getting the answers in excel Null hypothesis, Alternative hypothesis, Show answer (output table/summary table), and Conclusion based on the P value.arrow_forwardA company found that the daily sales revenue of its flagship product follows a normal distribution with a mean of $4500 and a standard deviation of $450. The company defines a "high-sales day" that is, any day with sales exceeding $4800. please provide a step by step on how to get the answers Q: What percentage of days can the company expect to have "high-sales days" or sales greater than $4800? Q: What is the sales revenue threshold for the bottom 10% of days? (please note that 10% refers to the probability/area under bell curve towards the lower tail of bell curve) Provide answers in the yellow cellsarrow_forwardBusiness Discussarrow_forward
- The following data represent total ventilation measured in liters of air per minute per square meter of body area for two independent (and randomly chosen) samples. Analyze these data using the appropriate non-parametric hypothesis testarrow_forwardeach column represents before & after measurements on the same individual. Analyze with the appropriate non-parametric hypothesis test for a paired design.arrow_forwardShould you be confident in applying your regression equation to estimate the heart rate of a python at 35°C? Why or why not?arrow_forward
arrow_back_ios
SEE MORE QUESTIONS
arrow_forward_ios
Recommended textbooks for you
 Linear Algebra: A Modern IntroductionAlgebraISBN:9781285463247Author:David PoolePublisher:Cengage Learning
Linear Algebra: A Modern Introduction
Algebra
ISBN:9781285463247
Author:David Poole
Publisher:Cengage Learning
What Are Research Ethics?; Author: HighSchoolScience101;https://www.youtube.com/watch?v=nX4c3V23DZI;License: Standard YouTube License, CC-BY
What is Ethics in Research - ethics in research (research ethics); Author: Chee-Onn Leong;https://www.youtube.com/watch?v=W8Vk0sXtMGU;License: Standard YouTube License, CC-BY