Concept explainers
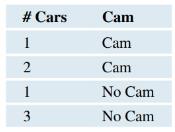
Traffic Cameras College students Jeannette Mujica, Ricardo Ceja Zarate, and Jessica Cerda conducted a survey in Oxnard, California, of the number of cars going through a yellow light at intersections with and without traffic cameras that are used to automatically fine drivers who run red lights. The cameras were very noticeable to drivers. The amount of traffic was constant throughout the study period (the afternoon commute.) The data record the number of cars that crossed the intersection during a yellow light for each light cycle. A small excerpt of the data is shown in the following table; see this text’s website for all the data. What differences, if any, do you see between intersections with cameras and those without? Use an appropriate graphical summary, and write a comparison of the distributions.

Want to see the full answer?
Check out a sample textbook solution
Chapter 2 Solutions
Introductory Statistics (2nd Edition)
Additional Math Textbook Solutions
A First Course in Probability (10th Edition)
Calculus for Business, Economics, Life Sciences, and Social Sciences (14th Edition)
APPLIED STAT.IN BUS.+ECONOMICS
Precalculus
Graphical Approach To College Algebra
A Problem Solving Approach To Mathematics For Elementary School Teachers (13th Edition)
- c. What are the first and third quartiles? First Quartiles (to 1 decimals) Third Quartiles (to 4 decimals) × ☑ Which companies spend the most money on advertising? Business Insider maintains a list of the top-spending companies. In 2014, Procter & Gamble spent more than any other company, a whopping $5 billion. In second place was Comcast, which spent $3.08 billion (Business Insider website, December 2014). The top 12 companies and the amount each spent on advertising in billions of dollars are as follows. Click on the datafile logo to reference the data. DATA file Company Procter & Gamble Comcast Advertising ($billions) $5.00 3.08 2.91 Company American Express General Motors Advertising ($billions) $2.19 2.15 ETET AT&T Ford Verizon L'Oreal 2.56 2.44 2.34 Toyota Fiat Chrysler Walt Disney Company J.P Morgan a. What is the mean amount spent on advertising? (to 2 decimals) 2.55 b. What is the median amount spent on advertising? (to 3 decimals) 2.09 1.97 1.96 1.88arrow_forwardMartinez Auto Supplies has retail stores located in eight cities in California. The price they charge for a particular product in each city are vary because of differing competitive conditions. For instance, the price they charge for a case of a popular brand of motor oil in each city follows. Also shown are the number of cases that Martinez Auto sold last quarter in each city. City Price ($) Sales (cases) Bakersfield 34.99 501 Los Angeles 38.99 1425 Modesto 36.00 294 Oakland 33.59 882 Sacramento 40.99 715 San Diego 38.59 1088 San Francisco 39.59 1644 San Jose 37.99 819 Compute the average sales price per case for this product during the last quarter? Round your answer to two decimal places.arrow_forwardConsider the following data and corresponding weights. xi Weight(wi) 3.2 6 2.0 3 2.5 2 5.0 8 a. Compute the weighted mean (to 2 decimals). b. Compute the sample mean of the four data values without weighting. Note the difference in the results provided by the two computations (to 3 decimals).arrow_forward
- Expert only,if you don't know it don't attempt it, no Artificial intelligence or screen shot it solvingarrow_forwardFor context, the image provided below is a quesion from a Sepetember, 2024 past paper in statistical modelingarrow_forwardFor context, the images attached below (the question and the related figure) is from a january 2024 past paperarrow_forward
- For context, the image attached below is a question from a June 2024 past paper in statisical modelingarrow_forwardFor context, the images attached below are a question from a June, 2024 past paper in statistical modelingarrow_forwardFor context, the images attached below (question and related graph) are from a February 2024 past paper in statistical modelingarrow_forward
- For context, the images attached below are from a February 2024 past paper in statistical modelingarrow_forwardFor context, the image provided below is a question from a September, 2024 past paper in statistical modelingarrow_forwardFor context, the image below is from a January 2024 past paper in statistical modelingarrow_forward
 Glencoe Algebra 1, Student Edition, 9780079039897...AlgebraISBN:9780079039897Author:CarterPublisher:McGraw Hill
 Holt Mcdougal Larson Pre-algebra: Student Edition...AlgebraISBN:9780547587776Author:HOLT MCDOUGALPublisher:HOLT MCDOUGAL
 Big Ideas Math A Bridge To Success Algebra 1: Stu...AlgebraISBN:9781680331141Author:HOUGHTON MIFFLIN HARCOURTPublisher:Houghton Mifflin Harcourt
 Functions and Change: A Modeling Approach to Coll...AlgebraISBN:9781337111348Author:Bruce Crauder, Benny Evans, Alan NoellPublisher:Cengage Learning
 College Algebra (MindTap Course List)AlgebraISBN:9781305652231Author:R. David Gustafson, Jeff HughesPublisher:Cengage Learning


