Introductory Statistics (2nd Edition)
2nd Edition
ISBN: 9780321978271
Author: Robert Gould, Colleen N. Ryan
Publisher: PEARSON
expand_more
expand_more
format_list_bulleted
Concept explainers
Textbook Question
Chapter 2, Problem 59CRE
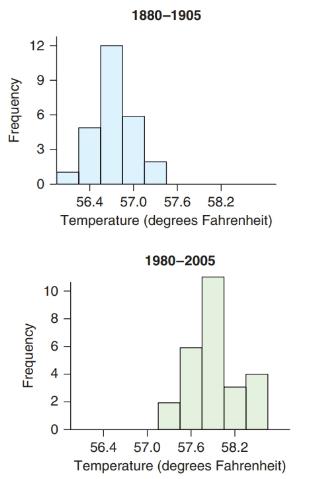
Global Temperatures The histograms show the average global temperature per year for two 26-year ranges in degrees Fahrenheit. The
Expert Solution & Answer
Want to see the full answer?
Check out a sample textbook solutionStudents have asked these similar questions
the length of time taken to run 100m a continous data?
Page
of 11
ZOOM +
5. The table shows how the cost of a carne asada taco at my favorite taco
stand has increased as they have become more popular since their
opening in 2013. Use the data to answer the questions below.
Year, x
2013, 0 2014, 1
2015, 2 2016, 3 2017, 4 2018, 5 2019,6
Cost ($) 0.50
0.55
0.65
0.75
0.90
1.00
1.10
(a) What is the regression line given by your TI-84 for this data?
Round values to 3 decimal places.
(b) Using the regression equation above, predict the cost of a carne asada
taco at my favorite taco stand in 2020. Show the work.
Please provide a clear solution. Kindly answer quickly 45 mins left.
Chapter 2 Solutions
Introductory Statistics (2nd Edition)
Ch. 2 - Body Mass Index The Dotplot shows body mass index...Ch. 2 - Cholesterol Levels The dotplot shows the...Ch. 2 - Ages of CEOs The histogram shows frequencies for...Ch. 2 - Sleep Hours The relative frequency histogram shows...Ch. 2 - Televisions (Example 1) The histogram shows the...Ch. 2 - Exercise Hours The histogram shows the...Ch. 2 - Shoes The graph is a dotplot of the number of...Ch. 2 - Condo Rental The dotplot shows rental prices per...Ch. 2 - Speeding Tickets (Example 2) A teacher asks 90...Ch. 2 - Breakfast Predict the shape of the distribution of...
Ch. 2 - Arm spans (Example 3) According to the ancient...Ch. 2 - Tuition The distribution of in-state annual...Ch. 2 - Ages of CEOs (Example 4) From the histogram in...Ch. 2 - Sleep Hours From the histogram shown in Exercise...Ch. 2 - Commute Times (Example 5) Use the histograms to...Ch. 2 - Spending on Clothes The histograms show the...Ch. 2 - Education (Example 6) In 2012, the General Social...Ch. 2 - Siblings The histogram shows the distribution of...Ch. 2 - Years of Education The GSS asked people how many...Ch. 2 - Hours Worked In the 2012 General Social Survey,...Ch. 2 - Matching Histograms match each of the following...Ch. 2 - Matching Histograms Match each of the following...Ch. 2 - Matching Match each description with the correct...Ch. 2 - Matching Match each description with the correct...Ch. 2 - Eating Out and jobs College students Jacqueline...Ch. 2 - Comparing Weights of Baseball and Soccer Players...Ch. 2 - Textbook Prices The table shows prices of 50...Ch. 2 - SAT scores The following table shows a random...Ch. 2 - Animal Longevity The following table in Exercise...Ch. 2 - Animal Gestation Periods The accompanying table...Ch. 2 - Tax Rate A StatCrunch survey asked people what...Ch. 2 - Pets A StatCrunch survey asked people whether they...Ch. 2 - Law School Tuition Data are shown for the cost of...Ch. 2 - Text Messages Recently, 115 users of StatCrunch...Ch. 2 - Beer, Calories Data are available on the number of...Ch. 2 - Beer, Alcohol Data are available on the percent...Ch. 2 - Changing Multiple-Choice Answers When Told Not to...Ch. 2 - Preventable Deaths According to the World Health...Ch. 2 - U.S. Distribution of wealth (Example 8) Michael...Ch. 2 - Education The graph shows the education of...Ch. 2 - Political Party Affiliation: Men The 2012 General...Ch. 2 - Political Party Affiliation Women The 2012 General...Ch. 2 - Prob. 43SECh. 2 - Retail Car Sales With gas prices rising, as they...Ch. 2 - Majors The table gives information on college...Ch. 2 - Adoptions The table gives information on the top...Ch. 2 - Garage The accompanying graph shows the...Ch. 2 - Body Image A student has gathered data on...Ch. 2 - Pie Chart of Sleep Hours The pie chart reports the...Ch. 2 - Age and Gender The following graph shows the ages...Ch. 2 - Musicians Survey: StatCrunch Graph The...Ch. 2 - Cell Phone Use Refer to the accompanying bar...Ch. 2 - Television The table shows the first few entries...Ch. 2 - Job The table shows the job categories for some...Ch. 2 - Hormone Replacement Therapy The use of the drug...Ch. 2 - E-Music The bar graph shows information reported...Ch. 2 - Hormone Replacement Therapy Again The following...Ch. 2 - Holding Your Breath A group of students held their...Ch. 2 - Global Temperatures The histograms show the...Ch. 2 - Employment after Law School Accredited law schools...Ch. 2 - Position for Breathing The graph shows the results...Ch. 2 - Opinions on Global Warming People were asked...Ch. 2 - Create a dotplot that has at least 10 observations...Ch. 2 - Create a dotplot that has at least 10 observations...Ch. 2 - Traffic Cameras College students Jeannette Mujica,...Ch. 2 - Ideal Weight Thirty-nine students (26 women and 13...Ch. 2 - MPH The graphs show the distribution of...Ch. 2 - Shoe Sizes The graph shows shoe sizes for men and...Ch. 2 - CEO Salaries Predict the shape of the distribution...Ch. 2 - Cigarettes A physician asks all of his patients to...Ch. 2 - Changing Multiple-Choice Answers When Told to Do...Ch. 2 - ER Visits for Injuries The graph shows the rates...
Additional Math Textbook Solutions
Find more solutions based on key concepts
z Scores. In Exercises 5-8, express all z scores with two decimal places.
8. Plastic Waste Data Set 31 “Garbage...
Elementary Statistics Using Excel (6th Edition)
Use the following information to answer the next 14 exercises: The mean age for all Foothill College students f...
Introductory Statistics
the proportion of red cars in the sample and display the sampling distribution of the sample proportion on dot ...
PRACTICE OF STATISTICS F/AP EXAM
1. How is a sample related to a population?
Elementary Statistics: Picturing the World (6th Edition)
Knowledge Booster
Learn more about
Need a deep-dive on the concept behind this application? Look no further. Learn more about this topic, statistics and related others by exploring similar questions and additional content below.Similar questions
- If you travel 100 miles in two hours, then your average speed for the trip is Average speed=_________=________arrow_forwardHeart Disease In a certain country, the number of deaths due to heart disease decreased from 235 in one year to 221 in the next year. What percentage decrease in deaths due to heart disease does this represent?arrow_forwardMortgage Rates The following table is taken from the website of Freddie Mac. It shows rates for 30-year fixed-rate mortgages since 1970. y=Year r=Mortgagerate 1975 9.05 1980 13.74 1985 12.43 1990 10.13 1995 7.93 2000 8.05 2005 5.87 2010 4.69 2015 3.84 a. Explain in practical terms the meaning of r(2003). b. Use the table to estimate the value of r(2003).arrow_forward
- Sheena obtains cash from an ATM machine. She suspects that the rate at which she spends the cash is affected by the amount of cash she withdrew at her previous visit to an ATM. To investigate this she deliberately varies the amount she withdraws. She records for her each visit to an ATM, the amount "x"(in $) withdrawn and the number of hours "y" until her next visit to an ATM. Withdrawal 1 2 3 4 5 6 X y 7 8 9 10 40 10 100 110 120 150 2090 80 130 5662 195 33094 27048 196214286 Observe the correlation coefficient value obtained, and comment on the strength of the relationship between the variables.arrow_forwardPlease show clear and complete solution! 30 Minutes left Thank you!arrow_forwardResearchers initiated a long-term study of the population of American black bears. One aspect of the study was to develop a model that could be used to predict a bear's weight (since it is not practical to weigh bears in the field). One variable thought to be related to weight is the length of the bear. The accompanying data represent the lengths and weights of 12 American black bears. Complete parts (a) through (d) below. Click the icon to view the data table. Click the icon to view the critical values table. ..... (a) Which variable is the explanatory variable based on the goals of the research? O A. The number of bears B. The weight of the bear O C. The length of the bear (b) Draw a scatter diagram of the data. Choose the correct graph below. O A. O B. O C. D. A Weight (kg) 180- AWeight (kg) 180- ALength (cm) 180- A Weight (kg) 180- 40- 100 40- 100 Length (cm) 40- 100 40- 100 200 200 200 200 Length (cm) Weight (kg) Length (cm) (c) Determine the linear correlation coefficient between…arrow_forward
- Rick is a school principal, and he is trying to decide if there is a relationship between conduct infractions and the number of students present at school during the day when infractions occur. How should he set up a scatterplot to help him see if there is a relationship? O plot the number of infractions on the y-axis and the number of students present on the x-axis O plot the number of infractions on the y-axis and the day of the week on the x-axis O plot the number of infractions on the x-axis and the number of students present on the y-axis O plot the number of infractions on the x-axis and the day of the week on the y-axisarrow_forwardThe distance (in kilometers) and price (in dollars) for one-way airline tickets from San Francisco to several cities are shown in the accompanying table. Complete parts a through d below. E Click the icon to view the data on airline ticket prices. a. Find the corelation coefficient for these data using a computer or statistical calculator. Use distance as the x-variable and price as the y-variable. (Round to three decimal places as needed.) r= b. Recalculate the correlation coefficient for these data using price as the x-variable and distance as the y-variable. What effect does this have on the correlation coefficient? Select the correct choice below and fill in the answer box to complete your choice. (Round to three decimal places as needed.) Airline Ticket Prices A. The correlation coefficient is r= The correlation coefficient decreases when the order of the variables is changed. B. The correlation coefficient is r= The correlation coefficient remains the same when the order of the…arrow_forwardAn aerobic exercise instructor submitted to the shipping company the data given in the following table, which shows the recommended maximum exercise heart rates for individuals of the given ages. See table below. If the Chief engineer is 40 years old, predict his maximum exercise heart rate. If your answer has decimal point round it off to two decimal places. Do not put space, comma or unit in your answer. Age (x years) Maximum heart rate(y beats per minute) 20 40 60 170 153 136arrow_forward
- Use the data in the following table, which lists carbon dioxide concentrations (in parts per million) for each year from 1960 to 2009, with projected values used for the last four years. After finding the values of the mean and range for each decade, find the values of x,and R. Also find the values of LCL and UCL for an R chart, and find the values of LCL and UCL for an x chart. Atmospheric Carbon Dioxide Concentrations (in parts per million) 1960s 313.3 315.1 315.8 317.2 319.4 320.4 321.9 323.2 324.8 326.4 1970s 327.9 329.7 331.5 333.1 334.8 335.3 337.1 337.9 340.5 341.6 1980s 342.8 344.8 345.8 347.1 349.1 350.6 352.1 352.8 355.4 355.8 1990s 357.5 358.9 360.7 361.9 363.9 365.3 366.4 367.8 369.6 370.5 2000s 372.2 374.7 376.2 376.6 377.8 379.5 381.1 382.7 384.6 385.8 x=enter your response here (Round to three decimal places as needed.)…arrow_forwardplease answer last 8 mins. Thank you!arrow_forwardAn business reviews data on the daily amount of calls it receives. Are the data discrete or continous?arrow_forward
arrow_back_ios
SEE MORE QUESTIONS
arrow_forward_ios
Recommended textbooks for you
- College AlgebraAlgebraISBN:9781305115545Author:James Stewart, Lothar Redlin, Saleem WatsonPublisher:Cengage LearningGlencoe Algebra 1, Student Edition, 9780079039897...AlgebraISBN:9780079039897Author:CarterPublisher:McGraw HillHolt Mcdougal Larson Pre-algebra: Student Edition...AlgebraISBN:9780547587776Author:HOLT MCDOUGALPublisher:HOLT MCDOUGAL
- Functions and Change: A Modeling Approach to Coll...AlgebraISBN:9781337111348Author:Bruce Crauder, Benny Evans, Alan NoellPublisher:Cengage LearningAlgebra: Structure And Method, Book 1AlgebraISBN:9780395977224Author:Richard G. Brown, Mary P. Dolciani, Robert H. Sorgenfrey, William L. ColePublisher:McDougal LittellAlgebra & Trigonometry with Analytic GeometryAlgebraISBN:9781133382119Author:SwokowskiPublisher:Cengage
College Algebra
Algebra
ISBN:9781305115545
Author:James Stewart, Lothar Redlin, Saleem Watson
Publisher:Cengage Learning
Glencoe Algebra 1, Student Edition, 9780079039897...
Algebra
ISBN:9780079039897
Author:Carter
Publisher:McGraw Hill
Holt Mcdougal Larson Pre-algebra: Student Edition...
Algebra
ISBN:9780547587776
Author:HOLT MCDOUGAL
Publisher:HOLT MCDOUGAL
Functions and Change: A Modeling Approach to Coll...
Algebra
ISBN:9781337111348
Author:Bruce Crauder, Benny Evans, Alan Noell
Publisher:Cengage Learning
Algebra: Structure And Method, Book 1
Algebra
ISBN:9780395977224
Author:Richard G. Brown, Mary P. Dolciani, Robert H. Sorgenfrey, William L. Cole
Publisher:McDougal Littell
Algebra & Trigonometry with Analytic Geometry
Algebra
ISBN:9781133382119
Author:Swokowski
Publisher:Cengage
Use of ALGEBRA in REAL LIFE; Author: Fast and Easy Maths !;https://www.youtube.com/watch?v=9_PbWFpvkDc;License: Standard YouTube License, CC-BY
Compound Interest Formula Explained, Investment, Monthly & Continuously, Word Problems, Algebra; Author: The Organic Chemistry Tutor;https://www.youtube.com/watch?v=P182Abv3fOk;License: Standard YouTube License, CC-BY
Applications of Algebra (Digit, Age, Work, Clock, Mixture and Rate Problems); Author: EngineerProf PH;https://www.youtube.com/watch?v=Y8aJ_wYCS2g;License: Standard YouTube License, CC-BY