Concept explainers
Queen City
Cincinnati, Ohio, also known as the Queen City, has a population of approximately 298.000 and is the third largest city in the state of Ohio. The Cincinnati metropolitan area has a population of about 2.2 million. The city is governed by a mayor and a nine-member city council. The city manager, who is responsible for the day-to-day operation of the city, reports to the mayor and city council. The city manager recently created the Office of Performance and Data Analytics with the goal of improving the efficiency of city operations.
TABLE 2.21 ANNUAL EXPENDITURES FOR QUEEN CITY (FIRST FOUR ENTRIES)

One of the first tasks of this new office is to review the previous year’s expenditures. The file QueenCity contains data on the previous year’s expenditures, including the following:
Department The number of the department incurring the expenditure
Department Description The name of the department incurring the description
Category The category of the expenditure
Fund The fund to which the expenditure was charged
Expenditure The dollar amount of the expense
Table 2.21 shows the first four entries of the 5427 expenditures for the year. The city manager would like to use this data to better understand how the city’s budget is being spent.
Managerial Report
Use tabular and graphical methods of
- 1. Tables and/or graphical displays that show the amount of expenditures by category and percentage of total expenditures by category.
- 2. A table that shows the amount of expenditures by department and the percentage of total expenditures by department. Combine any department with less than 1% into a category named “Other.”
- 3. A table that shows the amount of expenditures by fund and the percentage of total expenditures by fund. Combine any fund with less than 1 % into a category named “Other.”
1.
Make tabular and graphical displays that show the amount of expenditure by category and percentage of total expenditures by category.
Answer to Problem 3CP
The table represents the total amount of expenditure by category and percentage of total expenditures by category.
| Category | Total Expenditure | Percentage of total Expenditure |
| Capital | $198,365,854 | 29.98% |
| Payroll | $145,017,555 | 21.92% |
| Debt service | $86,913,978 | 13.14% |
| Contractual services | $85,043,249 | 12.85% |
| Fringe benefits | $66,053,340 | 9.98% |
| Fixed costs | $53,732,177 | 8.12% |
| Materials and supplies | $19,934,710 | 3.01% |
| Inventory | $6,393,394 | 0.97% |
| Payables | $180,435 | 0.03% |
| Grand Total | $661,634,693 | 100.0% |
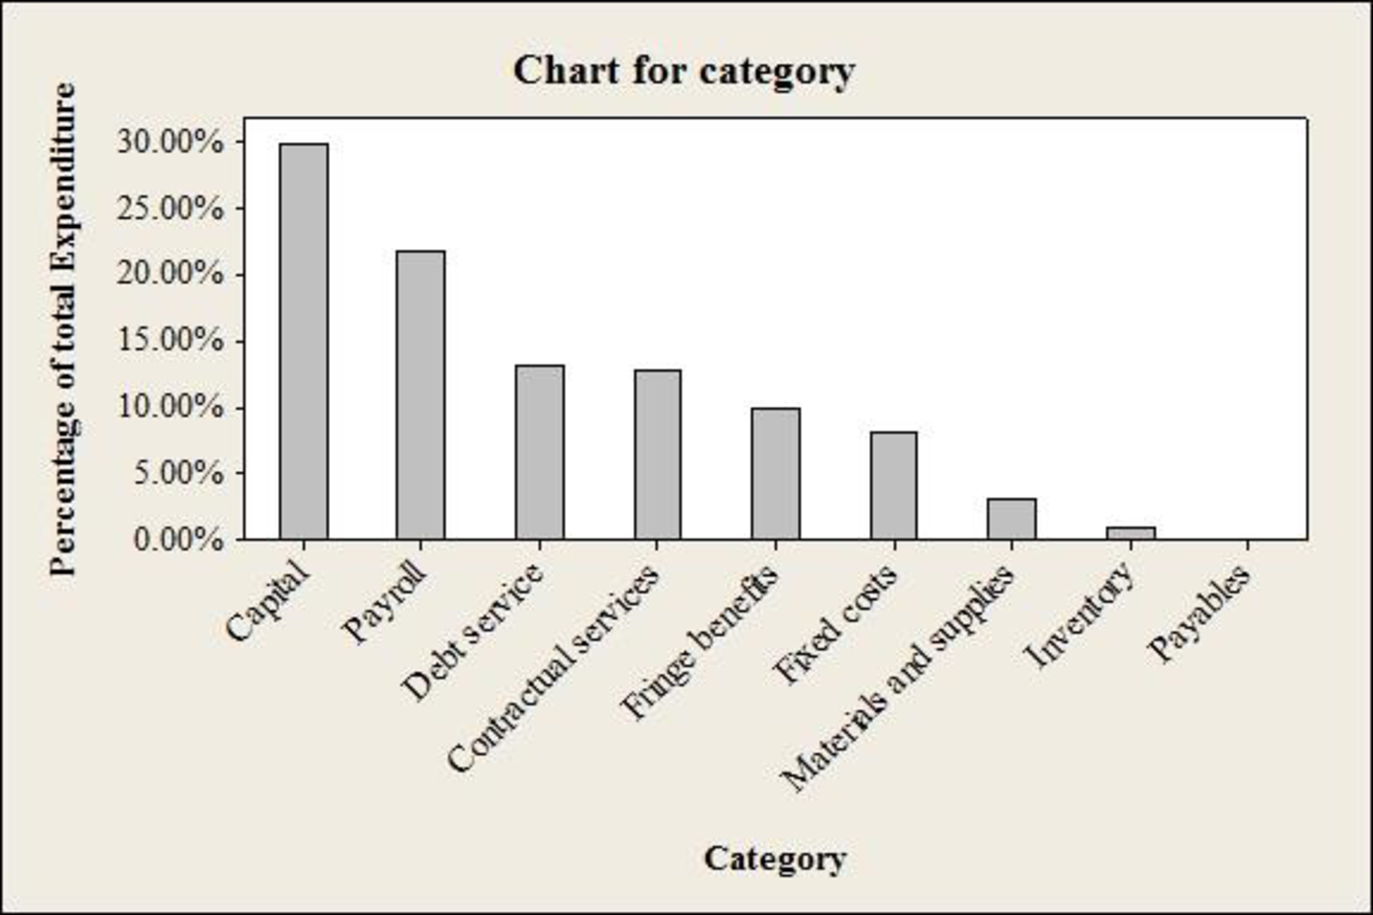
The bar chart for “Category” is given below:
Explanation of Solution
Calculation:
The table represents the sample of 5,427 entries annual expenditures for queen city (Cincinnati, Ohio) for the year. The five types of variables present in the data are department serial number, department description, category name, fund and expenditure.
From the data set, the variable “Category” consists of nine entities namely capital, payroll, debt service, contractual services, fringe benefits, fixed costs, Materials and supplies, inventory and payable.
Therefore, the following table shows the amount of all nine entities total expenditure by category.
| Category | Total Expenditure |
| Capital | $198,365,854 |
| Payroll | $145,017,555 |
| Debt service | $86,913,978 |
| Contractual services | $85,043,249 |
| Fringe benefits | $66,053,340 |
| Fixed costs | $53,732,177 |
| Materials and supplies | $19,934,710 |
| Inventory | $6,393,394 |
| Payables | $180,435 |
| Grand Total | $661,634,693 |
The percentage for capital is calculated as the ratio of total expenditure for capital to the grand totals of all categories.
The following table shows the percentage of amount of all nine entities total expenditure by category:
| Category | Total Expenditure | Percentage of total Expenditure |
| Capital | $198,365,854 | 29.98% |
| Payroll | $145,017,555 | 21.92% |
| Debt service | $86,913,978 | 13.14% |
| Contractual services | $85,043,249 | 12.85% |
| Fringe benefits | $66,053,340 | 9.98% |
| Fixed costs | $53,732,177 | 8.12% |
| Materials and supplies | $19,934,710 | 3.01% |
| Inventory | $6,393,394 | 0.97% |
| Payables | $180,435 | 0.03% |
| Grand Total | $661,634,693 | 100.0% |
Software procedure:
Step-by-step software procedure to obtain bar chart for category using MINITAB software is as follows:
- From Bars represent, choose Values from a table.
- UnderOne column of values, choose Simple. Click OK.
- Choose Simple, and then click OK.
- In Graph variables, enter the column of percent frequency for total expenditure.
- In Categorical variables, enter the column of entities of category.
- Click OK.
Output using the MINITAB software is given below:
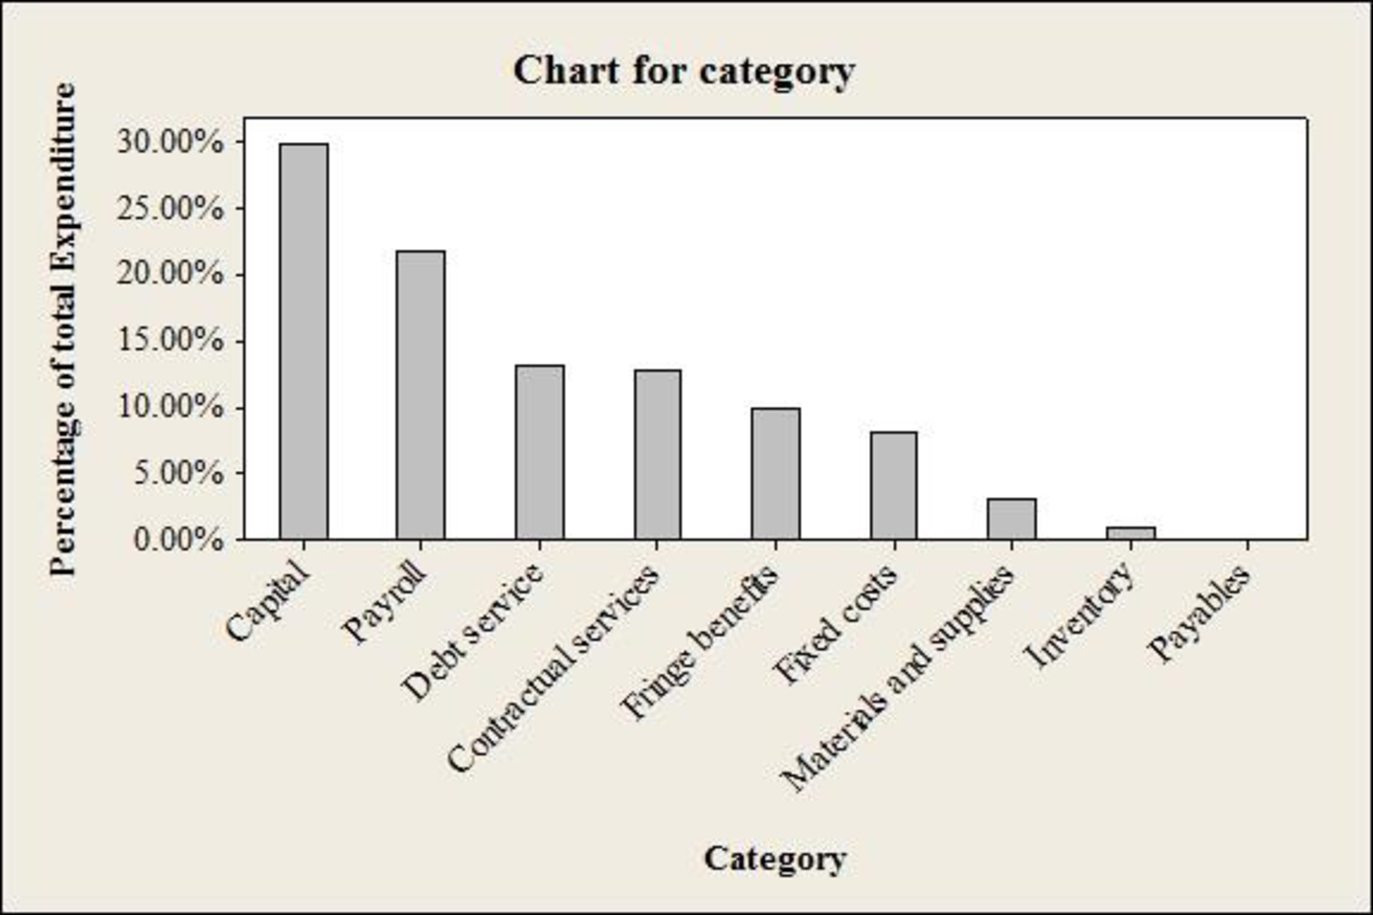
From the obtained table and bar chart, it is observed that the Capital expenditures and payroll account for over 50% of all expenditures.
Also, the total expenditures are over $660 million. Debt Service seems to be high, and it is found to be over 10% of total expenditures.
2.
Make tabular displays that show the amount of expenditure by department and percentage of total expenditures by department.
Answer to Problem 3CP
The table represents the total amount of expenditure by department and percentage of total expenditures by department.
| Department Description | Percentage of total Expenditure | Total Expenditure |
| Department of Police | 9.72% | 64,295,941 |
| Department of Sewers | 8.76% | 57,954,955 |
| Transportation and Engineering, Engineering | 8.72% | 57,686,199 |
| Department of Fire | 7.23% | 47,838,396 |
| Sewers, Debt Service | 6.59% | 43,585,814 |
| Finance, Risk Management | 5.39% | 35,654,238 |
| SORTA Operations | 3.62% | 23,975,000 |
| Water Works, Debt Service | 3.24% | 21,418,102 |
| Department of Water Works | 3.07% | 20,307,505 |
| Finance, Treasury | 2.80% | 18,531,650 |
| Economic Development | 2.13% | 14,078,735 |
| Division of Parking Facilities | 1.89% | 12,489,731 |
| Community Development, Housing | 1.75% | 11,556,943 |
| Enterprise Technology Solutions | 1.71% | 11,314,215 |
| Public Services, Fleet Services | 1.66% | 10,982,312 |
| Finance, Accounts & Audits | 1.66% | 10,960,345 |
| Transportation and Engineering, Planning | 1.63% | 10,764,138 |
| Public Services, Neighborhood Operations | 1.38% | 9,140,769 |
| Sewers, Millcreek | 1.30% | 8,575,226 |
| Health, Primary Health Care Centers | 1.25% | 8,268,632 |
| Water Works, Water Supply | 1.19% | 7,883,099 |
| Public Services, Facilities Management | 1.13% | 7,469,863 |
| Sewers, Wastewater Administration | 1.01% | 6,668,240 |
| Other department less than 1 percent each | 21.2% | 1,40,234,644 |
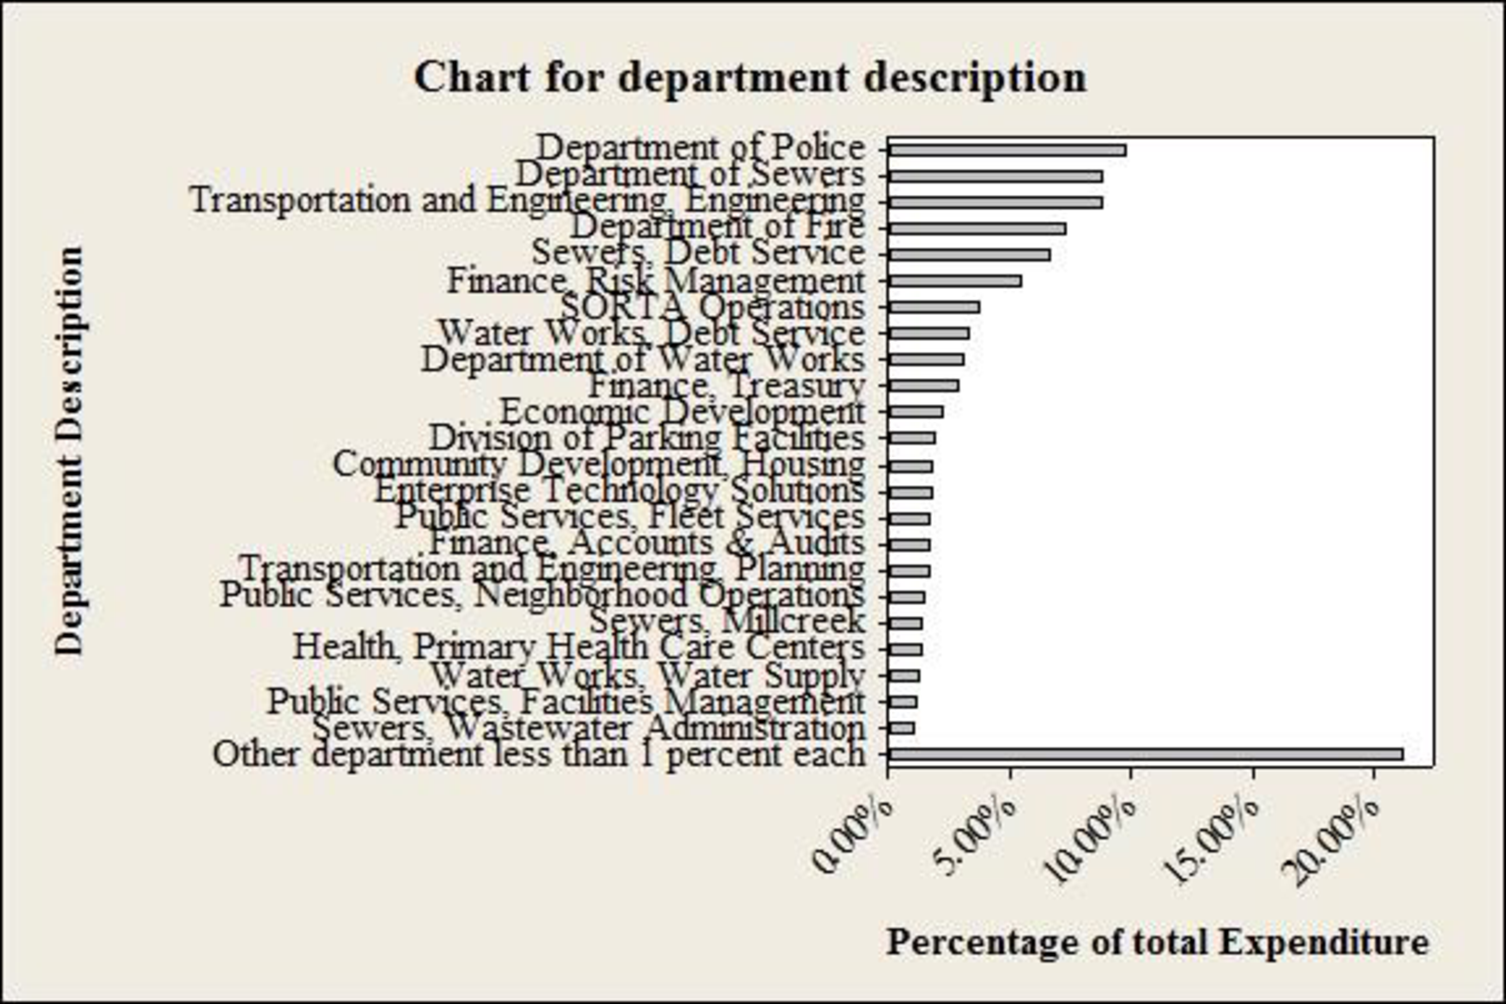
The bar chart for “Department description” is given below:
Explanation of Solution
Calculation:
Here, any departments with less than 1% are combined into a category named “other”.
Department descriptionwith less than 1% is tabulated as follows with named as “other”:
| Other (department description less than 1%) | Percentage of total Expenditure | Total Expenditure |
| Water Works, Distribution | 0.98% | 64,90,554 |
| Public Services, Traffic and Road Operations | 0.89% | 58,84,799 |
| Parks, Administrative and Program Services | 0.87% | 57,44,316 |
| Water Works, Commercial Services | 0.81% | 53,60,380 |
| Sewers, Wastewater Collection | 0.81% | 53,31,756 |
| Sewers, Director/Stormwater | 0.79% | 52,13,170 |
| Parks, Operations and Facility Mgmt | 0.76% | 50,08,200 |
| Police Emergency Communications | 0.69% | 45,57,589 |
| Division of Convention Center | 0.67% | 44,60,267 |
| Health, Primary Health Care Programs | 0.58% | 38,21,334 |
| Health, Community Health Services | 0.56% | 36,75,649 |
| Sewers, Maintenance | 0.55% | 36,68,040 |
| Water Works, Water Quality and Treatment | 0.51% | 33,95,988 |
| Recreation, Support Services | 0.50% | 33,15,938 |
| Law Department | 0.47% | 30,78,594 |
| Recreation, Golf | 0.42% | 27,81,652 |
| Water Works, Business Services | 0.41% | 26,93,873 |
| New Construction & Building Standards | 0.40% | 26,77,798 |
| Water Works, Engineering | 0.39% | 25,83,805 |
| Division of Traffic Engineering | 0.38% | 25,04,453 |
| Cincinnati Public School Reserve | 0.38% | 25,00,000 |
| Sewers, Little Miami | 0.37% | 24,39,869 |
| Planning, Licenses & Permits | 0.36% | 23,71,973 |
| Workers' Compensation Insuranced | 0.33% | 22,14,094 |
| Motorized and Construction Equipment | 0.33% | 21,87,298 |
| Recreation, Maintenance | 0.33% | 21,62,545 |
| General Fund Overhead | 0.32% | 20,95,756 |
| Health, Primary School &Adolesent | 0.31% | 20,74,254 |
| Community Development Administration | 0.30% | 19,68,773 |
| Sewers, Industrial Waste | 0.28% | 18,41,374 |
| Office of the City Manager | 0.26% | 17,12,437 |
| Sewers, Project Delivery | 0.25% | 16,82,688 |
| Finance, Purchasing | 0.24% | 16,00,148 |
| Recreation, Athletics | 0.24% | 15,82,290 |
| Office of Environmental Qualities | 0.23% | 15,48,437 |
| Recreation, West Region | 0.22% | 14,87,931 |
| Finance, Income Tax | 0.22% | 14,83,479 |
| Health, Commissioner | 0.21% | 14,18,825 |
| Recreation, Central Region | 0.21% | 13,93,663 |
| Recreation, East Region | 0.20% | 13,50,682 |
| Community Development | 0.20% | 13,37,001 |
| Sewers, Muddy Creek | 0.18% | 12,11,584 |
| Health, Technical Resources | 0.17% | 11,22,229 |
| Sewers, Planning | 0.17% | 10,92,095 |
| Enterprise Software and Licenses | 0.16% | 10,82,024 |
| Water Works, IT | 0.16% | 10,39,488 |
| Sewers, Wastewater Engineering | 0.15% | 9,73,882 |
| Department of Human Resources | 0.14% | 9,29,460 |
| Department Of Planning & Buildings | 0.14% | 9,11,988 |
| Office and Technical Equipment | 0.13% | 8,63,762 |
| Bond Fund - Principal and Interest | 0.12% | 7,74,523 |
| Sewers, Sycamore | 0.11% | 7,54,132 |
| Transportation and Engineering Director | 0.11% | 7,20,092 |
| Division of Aviation | 0.11% | 7,02,480 |
| Budget & Evaluation | 0.08% | 5,62,270 |
| Sewers, Polk Run | 0.08% | 5,32,890 |
| Sewers, Taylor Creek | 0.08% | 5,29,774 |
| Citizens' Complaint Authority | 0.07% | 4,31,449 |
| Sewers, Superintendent | 0.06% | 4,28,268 |
| Contribution to Fire Pension | 0.06% | 4,16,783 |
| Contribution to Police Pension | 0.06% | 4,00,439 |
| Public Services, Director | 0.06% | 3,97,815 |
| Port Authority Greater Cincinnati Development | 0.05% | 3,50,000 |
| City Council | 0.05% | 3,37,658 |
| Hamilton Co. Auditor & Treasurer Fees | 0.05% | 2,98,758 |
| Office of The Clerk of Council | 0.04% | 2,93,185 |
| Office of The Mayor | 0.04% | 2,87,622 |
| Lump Sum Payments | 0.04% | 2,52,054 |
| Finance Director’s Office | 0.03% | 2,13,548 |
| County Clerk Fees | 0.03% | 1,75,000 |
| Public Employees Assistance Program | 0.02% | 1,61,711 |
| Police and Fire Fighter's Insurance | 0.02% | 1,15,000 |
| Parks, Office of Director | 0.01% | 94,987 |
| Special Investigations/Studies | 0.01% | 92,210 |
| Councilmember PG Sittenfeld | 0.01% | 77,451 |
| Surplus | 0.01% | 76,091 |
| Councilmember Y. Simpson | 0.01% | 70,985 |
| Councilmember W. Young | 0.01% | 63,012 |
| Councilmember R. Qualls | 0.01% | 62,862 |
| Councilmember C. Seelbach | 0.01% | 60,177 |
| Councilmember Quinlivan | 0.01% | 57,685 |
| Councilmember C. Winburn | 0.01% | 57,654 |
| Downtown Special Inprovement District | 0.01% | 56,000 |
| Memberships & Publications | 0.01% | 53,150 |
| Cincinnati Music Hall | 0.01% | 50,000 |
| Election Expense | 0.01% | 46,580 |
| Convention Facility Authority | 0.01% | 45,700 |
| Councilmember C. Thomas | 0.01% | 45,603 |
| Councilmember C. Smitherman | 0.01% | 43,141 |
| Mayor's Office Obligations | 0.01% | 41,194 |
| State Unemployment Comp | 0.00% | 31,671 |
| Manager's Office Obligations | 0.00% | 13,956 |
| Councilmember P. Thomas | 0.00% | 13,168 |
| Judgments Against the City | 0.00% | 7,644 |
| Department of Public Recreation | 0.00% | 5,093 |
| Audit & Examiners Fees | 0.00% | 5,000 |
From the data set, the variable “department description” has 119 different departments out of which 96 departments whose percentage is less than 1.
Therefore, the following table shows the expenditure of all 119 different departments.
| Department Description | Total Expenditure |
| Department of Police | 64,295,941 |
| Department of Sewers | 57,954,955 |
| Transportation and Engineering, Engineering | 57,686,199 |
| Department of Fire | 47,838,396 |
| Sewers, Debt Service | 43,585,814 |
| Finance, Risk Management | 35,654,238 |
| SORTA Operations | 23,975,000 |
| Water Works, Debt Service | 21,418,102 |
| Department of Water Works | 20,307,505 |
| Finance, Treasury | 18,531,650 |
| Economic Development | 14,078,735 |
| Division of Parking Facilities | 12,489,731 |
| Community Development, Housing | 11,556,943 |
| Enterprise Technology Solutions | 11,314,215 |
| Public Services, Fleet Services | 10,982,312 |
| Finance, Accounts & Audits | 10,960,345 |
| Transportation and Engineering, Planning | 10,764,138 |
| Public Services, Neighborhood Operations | 9,140,769 |
| Sewers, Millcreek | 8,575,226 |
| Health, Primary Health Care Centers | 8,268,632 |
| Water Works, Water Supply | 7,883,099 |
| Public Services, Facilities Management | 7,469,863 |
| Sewers, Wastewater Administration | 6,668,240 |
| Other department less than 1 percent each | 140,234,644 |
| Grand Total | 661,634,692 |
The percentage for department description is calculated as the ratio of total expenditure to the grand totals all departments.
Therefore, the following table shows the percentage of amount of all department total expenditure by department.
| Department Description | Percentage of total Expenditure |
| Department of Police | 9.72% |
| Department of Sewers | 8.76% |
| Transportation and Engineering, Engineering | 8.72% |
| Department of Fire | 7.23% |
| Sewers, Debt Service | 6.59% |
| Finance, Risk Management | 5.39% |
| SORTA Operations | 3.62% |
| Water Works, Debt Service | 3.24% |
| Department of Water Works | 3.07% |
| Finance, Treasury | 2.80% |
| Economic Development | 2.13% |
| Division of Parking Facilities | 1.89% |
| Community Development, Housing | 1.75% |
| Enterprise Technology Solutions | 1.71% |
| Public Services, Fleet Services | 1.66% |
| Finance, Accounts & Audits | 1.66% |
| Transportation and Engineering, Planning | 1.63% |
| Public Services, Neighborhood Operations | 1.38% |
| Sewers, Millcreek | 1.30% |
| Health, Primary Health Care Centers | 1.25% |
| Water Works, Water Supply | 1.19% |
| Public Services, Facilities Management | 1.13% |
| Sewers, Wastewater Administration | 1.01% |
| Other department less than 1 percent each | 21.2% |
Software procedure:
Step-by-step software procedure to obtain bar chart for category using MINITAB software is as follows:
- From Bars represent, choose Values from a table.
- Under One column of values, choose Simple. Click OK.
- Choose Simple, and then click OK.
- In Graph variables, enter the column of percent frequency for total expenditure in department.
- In Categorical variables, enter the column of entities of department
- Click OK.
Output using the MINITAB software is given below:
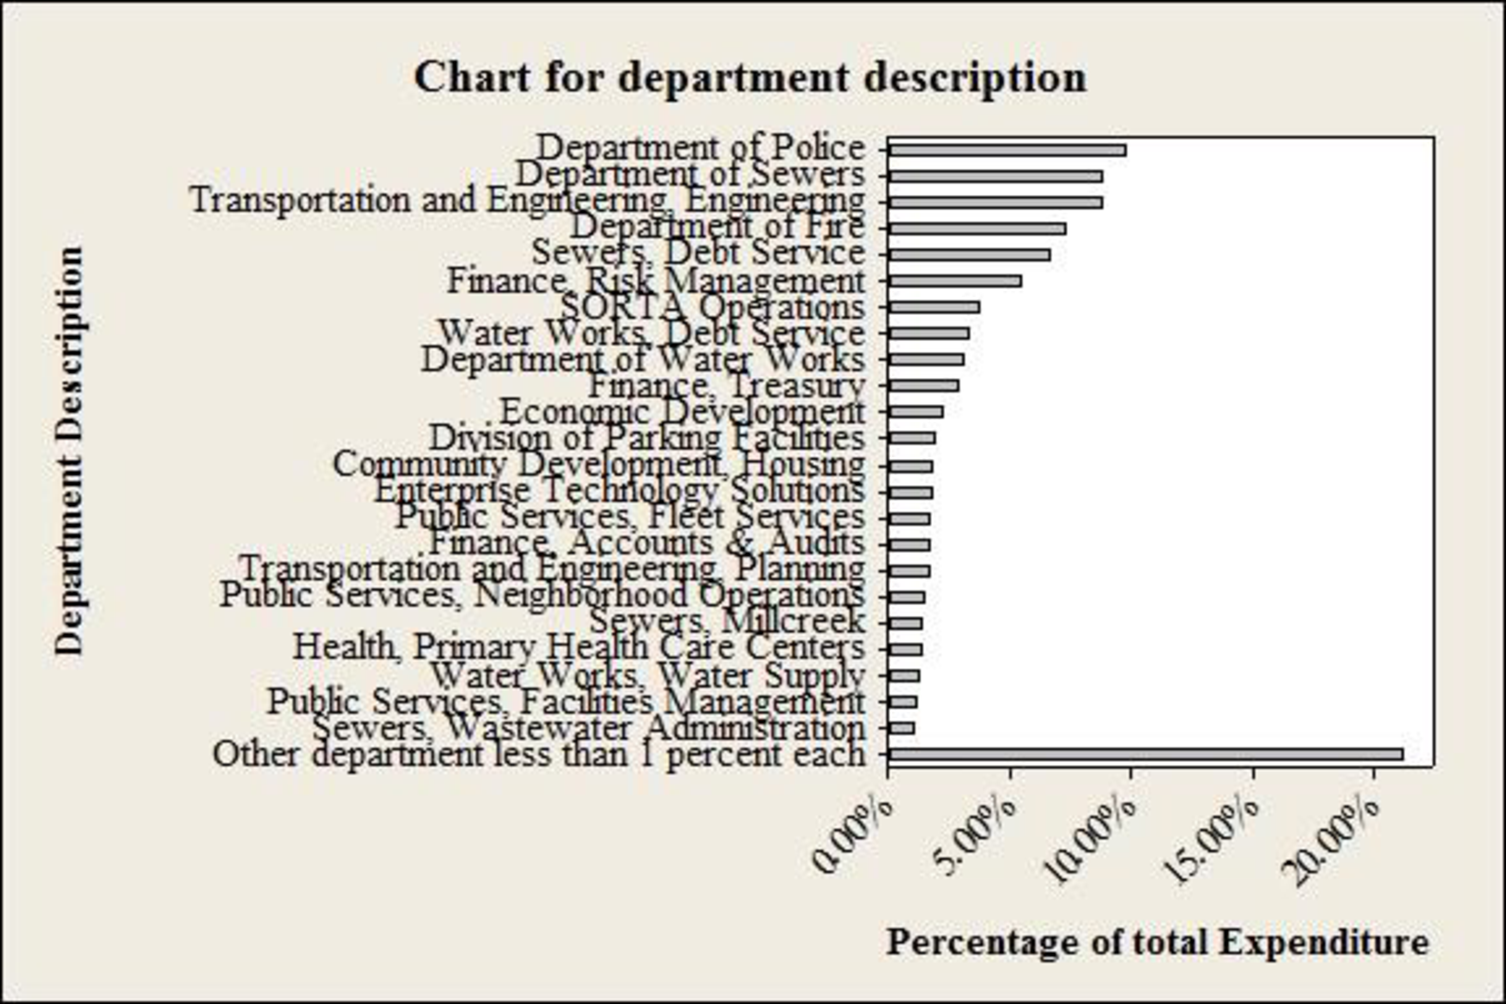
Interpretation:
- From the obtained table and bar chart, it is observed that, 96 departments showing total expenditure as less than 1% over 119 departments.
- There are six individual departments namely police, sewers, transportation Engineering, Fire, sewer debt service and financial/Risk management has total expenditure approximately 5 percent and more.
- Further, other department less than 1 percent each seems to be high, in terms of total expenditure percentage.
c.
Make tabular displays that show the amount of expenditure by fund and percentage of total expenditures by fund and Combine any department with less than 1% into a category named “other”.
Answer to Problem 3CP
The table represents the total amount of expenditure by Fund and percentage of total expenditures by Fund.
| Fund | Total expenditure | percentage of total expenditure |
| 050 - general fund | 16,86,07,659 | 25.5% |
| 980 - capital projects | 10,61,80,470 | 16.0% |
| 701 - metropolitan sewer district of greater cincinnati | 8,37,13,741 | 12.7% |
| 704 - metropolitan sewer district capital improvements | 5,79,54,955 | 8.8% |
| 101 - water works | 5,22,92,202 | 7.9% |
| 711 - risk management | 3,23,80,425 | 4.9% |
| 759 - income tax - transit | 2,42,39,259 | 3.7% |
| 151 - bond retirement - city | 1,55,84,916 | 2.4% |
| 202 - fleet services | 1,09,94,649 | 1.7% |
| 898 - water works improvement 12 | 84,83,304 | 1.3% |
| 897 - water works improvement 11 | 84,34,379 | 1.3% |
| 302 - income tax - infrastructure | 71,02,773 | 1.1% |
| other (less than 1% each) | 8,56,65,960 | 12.9% |
| Grand Total | 66,16,34,693 | 100.0% |
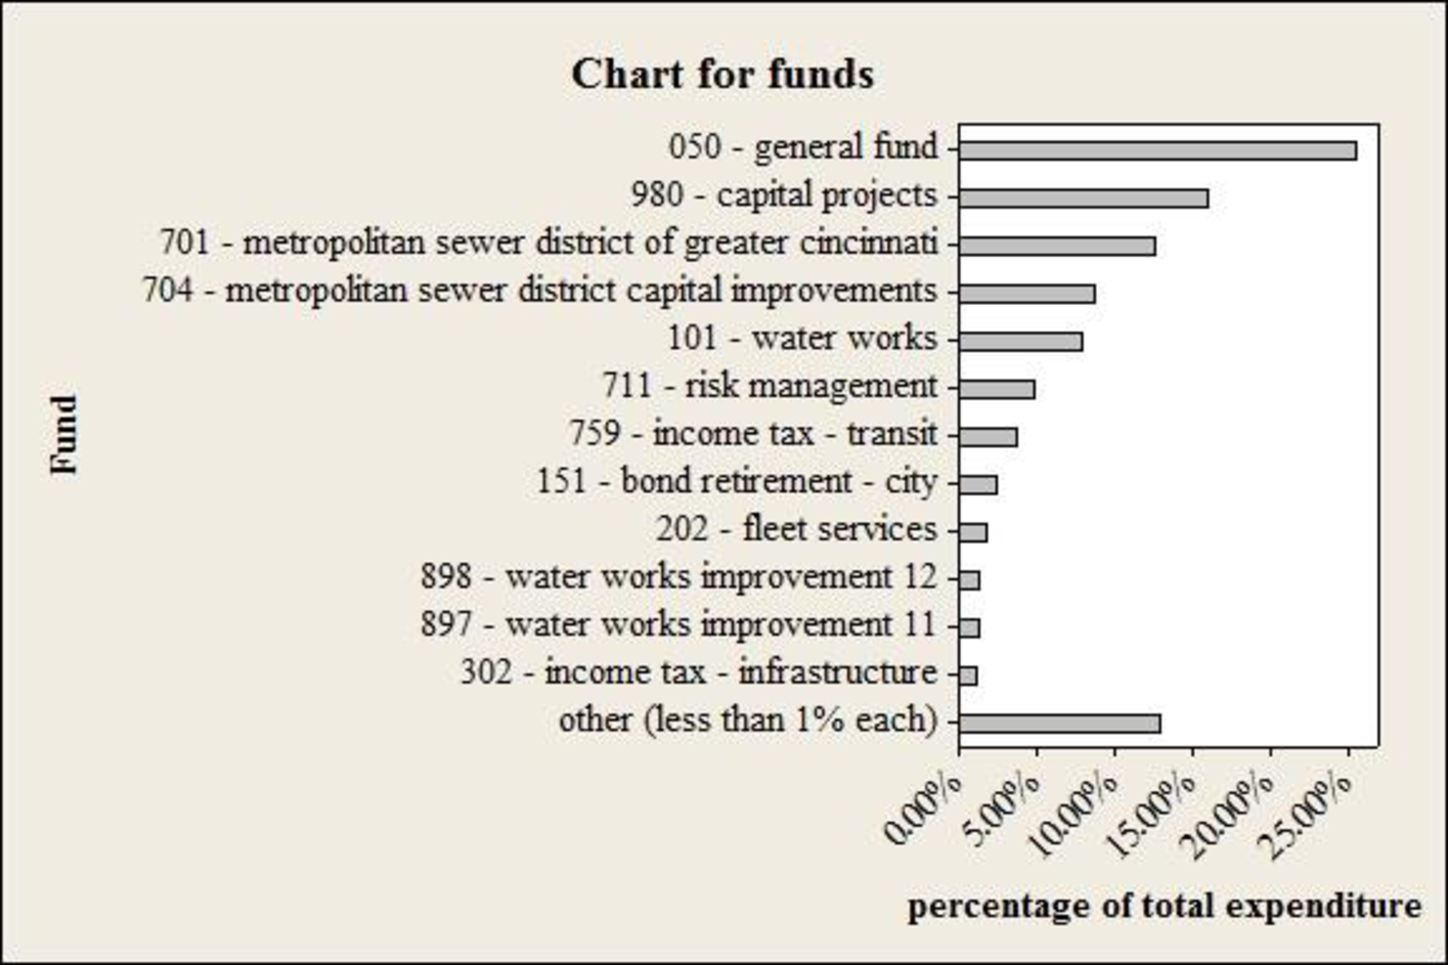
The bar chart for “Fund” is given below:
Explanation of Solution
Calculation:
Fund with less than 1% is tabulated as follows with named as “other”:
| Other (Fund less than 1%) | Total Expenditure | Percentage of total expenditure |
| 155 – u square revenue bonds -trustee | 47,48,810 | 0.80% |
| 304 - community development block grant | 46,96,312 | 0.70% |
| 301 - street construction, maintenance and repair | 40,53,506 | 0.70% |
| 103 - duke energy convention center | 35,08,157 | 0.60% |
| 102 - parking system facilities | 33,88,305 | 0.50% |
| 702 - enterprise technology solutions | 32,16,237 | 0.50% |
| 762 - urban redevelopment tax increment equivalent | 28,16,029 | 0.50% |
| 105 - municipal golf activities | 25,96,303 | 0.40% |
| 395 - health services | 24,11,634 | 0.40% |
| 107 - stormwater management | 23,25,888 | 0.40% |
| 368 - law enforcement grant | 22,22,595 | 0.40% |
| 410 - shelter plus care program | 21,62,535 | 0.30% |
| 449 - cincinnati area geographic information system (cagis) | 21,59,283 | 0.30% |
| 353 - home health services | 20,99,548 | 0.30% |
| 457 - clear fund | 19,57,914 | 0.30% |
| 213 - worker''s compensation | 18,17,200 | 0.30% |
| 758 - income tax permanent improvement fund | 17,66,123 | 0.30% |
| 214 - water works stores - chemicals | 15,26,281 | 0.30% |
| 204 - water works stores - materials | 15,06,447 | 0.20% |
| 391 - women and infants food grant program | 14,26,434 | 0.20% |
| 472 - fire grants | 13,62,498 | 0.20% |
| 307 - convention center expansion tax | 12,96,800 | 0.20% |
| 212 - employee safety and risk management | 12,16,265 | 0.20% |
| 491 - municipal public improvement equivalent fund | 12,12,813 | 0.20% |
| 438 - neiborhood stabilization program | 12,11,603 | 0.20% |
| 795 - downtown special inprovement district | 12,02,786 | 0.20% |
| 201 - printing services/ stores | 11,41,805 | 0.20% |
| 306 - municipal motor vehicle license tax | 10,77,283 | 0.20% |
| 323 - recreation special activities | 10,69,119 | 0.20% |
| 411 - home investment trust | 9,91,223 | 0.20% |
| 349 - urban renewal debt retirement | 9,79,853 | 0.10% |
| 350 - public health research | 8,51,919 | 0.10% |
| 418 - federal health program income | 8,48,578 | 0.10% |
| 792 - forestry | 7,40,592 | 0.10% |
| 340 - centennial operations | 7,24,704 | 0.10% |
| 757 - miscellaneous permanent improvement fund | 6,62,729 | 0.10% |
| 104 - lunken airport | 5,86,663 | 0.10% |
| 487 - cuf/heights equivalent fund | 5,62,261 | 0.10% |
| 483 - downtown/otr east equivalent fund | 5,58,694 | 0.10% |
| 156 - fountain square west revenue bonds - trustee | 5,57,577 | 0.10% |
| 412 - food service license fees | 5,50,645 | 0.10% |
| 369 - criminal activity forfeiture - state | 5,23,925 | 0.10% |
| 488 –corryville equivalent fund | 5,19,767 | 0.10% |
| 502 - arra federal grants | 5,09,814 | 0.10% |
| 445 - emergency shelter | 4,53,541 | 0.10% |
| 465 - housing opportunities for persons with aids | 3,73,929 | 0.10% |
| 498 –maidisonvill equivalent fund | 3,63,449 | 0.10% |
| 332 - krohn conservatory | 3,02,862 | 0.10% |
| 364 - 911 cell phone fees | 2,99,652 | 0.00% |
| 381 - cincinnati abatement project | 2,84,022 | 0.00% |
| 317 - urban development - property operations | 2,28,247 | 0.00% |
| 461 - fema grant | 2,19,424 | 0.00% |
| 793 - boulevard light energy and maintenance (blem) | 1,83,378 | 0.00% |
| 324 - recreation federal grant projects | 1,78,387 | 0.00% |
| 166 - graeters revenue bonds - trustee | 1,76,113 | 0.00% |
| 326 - park donations and special activity | 1,71,770 | 0.00% |
| 210 - highway maintenance stores | 1,69,814 | 0.00% |
| 342 - new city buildings operations | 1,67,023 | 0.00% |
| 420 - public employee assistance program | 1,65,141 | 0.00% |
| 446 - health network | 1,64,337 | 0.00% |
| 209 - property management | 1,62,435 | 0.00% |
| 618 - towing charges - private operators | 1,50,000 | 0.00% |
| 314 - special events | 1,46,679 | 0.00% |
| 481 - downtown south/riverfront equivalent fund | 1,44,066 | 0.00% |
| 367 - criminal activity forfeiture - federal | 1,31,116 | 0.00% |
| 753 - expressways/gateways | 1,26,717 | 0.00% |
| 486 - east walnut hills equivalent fund | 1,25,855 | 0.00% |
| 499 - oakley equivalent fund | 1,23,924 | 0.00% |
| 436 - environmental studies | 1,22,482 | 0.00% |
| 318 - sawyer point | 1,15,771 | 0.00% |
| 330 - park lodge/pavilion deposits | 1,02,413 | 0.00% |
| 482 - downtown/otr west equivalent fund | 97,418 | 0.00% |
| 756 - water works capital | 78,225 | 0.00% |
| 485 - walnut hills equivalent fund | 77,402 | 0.00% |
| 207 - recreation stores | 76,091 | 0.00% |
| 161 - msd debt service - trustee - multi series | 71,262 | 0.00% |
| 752 - park board | 69,499 | 0.00% |
| 415 - immunization action plan | 63,781 | 0.00% |
| 478 - justice assistance grant | 56,049 | 0.00% |
| 425 - heart health in hamilton county project | 48,994 | 0.00% |
| 387 - lead hazard control research grant | 48,025 | 0.00% |
| 791 - sidewalks | 45,700 | 0.00% |
| 715 - convention facility authority | 44,830 | 0.00% |
| 454 –metrolpolitain medical response | 42,877 | 0.00% |
| 428 - urban forestry | 41,771 | 0.00% |
| 448 - health care services for the homeless | 41,475 | 0.00% |
| 370 - drug offender fines | 39,325 | 0.00% |
| 363 - solid waste disposal control | 38,714 | 0.00% |
| 490 - evanston equivalent fund | 37,825 | 0.00% |
| 354 - household sewage treatment fees | 35,989 | 0.00% |
| 380 - lead poisoning control | 35,194 | 0.00% |
| 394 - state health program income | 29,632 | 0.00% |
| 413 - swimming pool license fees | 26,801 | 0.00% |
| 476 - uasi grant | 25,094 | 0.00% |
| 405 - market facilities | 24,099 | 0.00% |
| 389 - communications and marketing activities | 22,805 | 0.00% |
| other (less than 1% each) | 85,665,960 | 12.9% |
From the above table, the other category has the total expenditure $85,665,960.
Therefore, the following table shows the amount of all 13 entities total expenditure by Fund.
| Fund | Total expenditure |
| 050 - general fund | 16,86,07,659 |
| 980 - capital projects | 10,61,80,470 |
| 701 - metropolitan sewer district of greater cincinnati | 8,37,13,741 |
| 704 - metropolitan sewer district capital improvements | 5,79,54,955 |
| 101 - water works | 5,22,92,202 |
| 711 - risk management | 3,23,80,425 |
| 759 - income tax - transit | 2,42,39,259 |
| 151 - bond retirement - city | 1,55,84,916 |
| 202 - fleet services | 1,09,94,649 |
| 898 - water works improvement 12 | 84,83,304 |
| 897 - water works improvement 11 | 84,34,379 |
| 302 - income tax - infrastructure | 71,02,773 |
| other (less than 1% each) | 8,56,65,960 |
| Total | 66,16,34,693 |
The percentage for fund is calculated as the ratio of total expenditure to the grand totals all funds.
Therefore, the following table shows the percentage of amount of all fund total expenditure by funds
| Fund | Percentage of total expenditure |
| 050 - general fund | 25.5% |
| 980 - capital projects | 16.0% |
| 701 - metropolitan sewer district of greater cincinnati | 12.7% |
| 704 - metropolitan sewer district capital improvements | 8.8% |
| 101 - water works | 7.9% |
| 711 - risk management | 4.9% |
| 759 - income tax - transit | 3.7% |
| 151 - bond retirement - city | 2.4% |
| 202 - fleet services | 1.7% |
| 898 - water works improvement 12 | 1.3% |
| 897 - water works improvement 11 | 1.3% |
| 302 - income tax - infrastructure | 1.1% |
| other (less than 1% each) | 12.9% |
| Total | 100.0% |
Software procedure:
Step-by-step software procedure to obtain bar chart for category using MINITAB software is as follows:
- From Bars represent, choose Values from a table.
- Under One column of values, choose Simple. Click OK.
- Choose Simple, and then click OK.
- In Graph variables, enter the column of percent frequency for total expenditure in funds.
- In Categorical variables, enter the column of entities of funds.
- Click OK.
Output using the MINITAB software is given below:
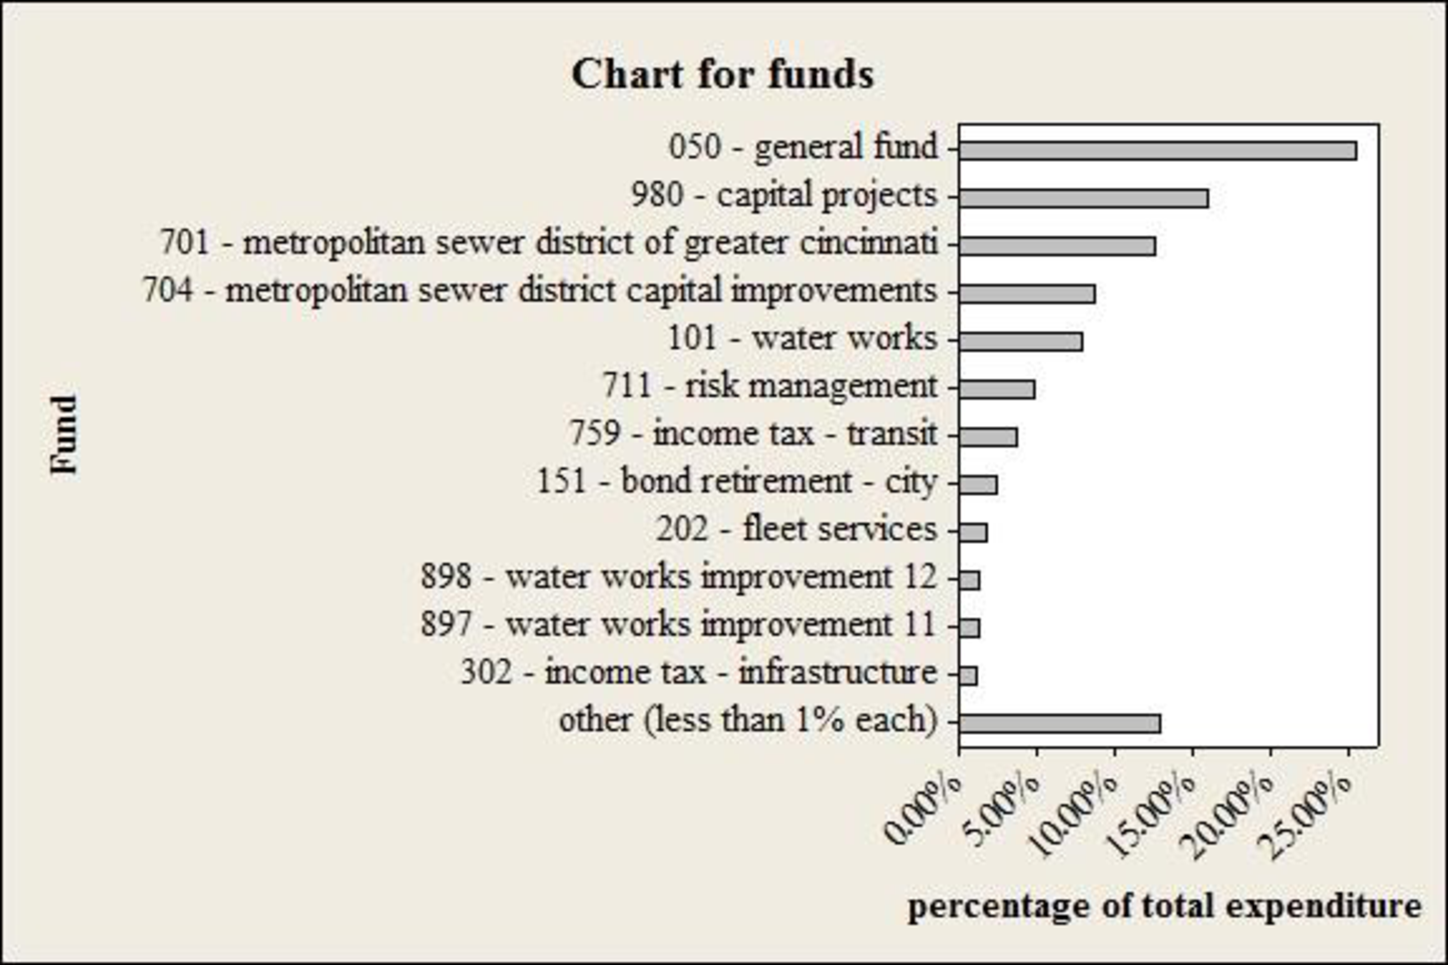
Interpretationn:
- From the obtained table and bar chart, it is observed that, the fund category 050-General fund seems to be high, in terms of total expenditure percentage.
Want to see more full solutions like this?
Chapter 2 Solutions
Statistics for Business & Economics (with XLSTAT Education Edition Printed Access Card) (MindTap Course List)
- You’re scrolling through Instagram and you notice that a lot of people are posting selfies. This piques yourcuriosity and you want to estimate the percentage of photos on Instagram that are selfies.(a) (5 points) Is there a “ground truth” for the percentage of selfies on Instagram? Why or why not?(b) (5 points) Is it possible to estimate the ground truth percentage of selfies on Instagram?Irrespective of your answer to the previous question, you decide to pull up n = 250 randomly chosenphotos from your friends’ Instagram accounts and find that 32% of these photos are selfies.(c) (15 points) Determine which of the following is an observation, a variable, a sample statistic (valuecalculated based on the observed sample), or a population parameter.• A photo on Instagram.• Whether or not a photo is a selfie.• Percentage of all photos on Instagram that are selfies.• 32%.(d) (5 points) Based on the sample you collected, do you think 32% is a reliable ballpark estimate for theground truth…arrow_forwardCan you explain this statement below in layman's terms? Secondary Analysis with Generalized Linear Mixed Model with clustering for Hospital Center and ICUvs Ward EnrolmentIn a secondary adjusted analysis we used generalized linear mixed models with random effects forcenter (a stratification variable in the primary analyses). In this analysis, the relative risk for the primaryoutcome of 90-day mortality for 7 versus 14 days of antibiotics was 0.90 (95% Confidence Interval [CI]0.78, 1.05).arrow_forwardIn a crossover trial comparing a new drug to a standard, π denotes the probabilitythat the new one is judged better. It is desired to estimate π and test H0 : π = 0.5against H1 : π = 0.5. In 20 independent observations, the new drug is better eachtime.(a) Find and plot the likelihood function. Give the ML estimate of π (Hint: youmay use the plot function in R)arrow_forward
- Can you explain what this analysis means in layman's terms? - We calculated that a target sample size of 3626, which was based on anticipated baseline 90-day mortality of 22% and a noninferiority margin of no more than 4 percentage points, would give the trial 80% power, at a one-sided alpha level of 2.5%, accounting for a maximum of 5% loss to follow-up and for early stopping rules for three interim analyses.-arrow_forwardCan you help me understand this analysis? A 95.7% confidence interval is shown for the intention-to-treat analysis (accounting for alpha spending in interim analyses), and 95% confidence intervals are shown for the other two analyses. The widths of the confidence intervals have not been adjusted for multiplicity. The dashed line indicates the noninferiority margin of 4 percentage points.arrow_forwardTitle: Analyzing Customer Satisfaction for UnileverAs a member of Unilever's Customer Experience Management team, you are responsible forevaluating customer satisfaction levels and monitoring competitive moves. This case studyinvolves analyzing satisfaction data to test two key hypotheses about Unilever's performancerelative to its main competitor, Procter & Gamble (P&G).Unilever’s leadership team has emphasized the importance of customer satisfaction inmaintaining competitive advantage and market leadership. As part of this initiative, yourteam regularly monitors satisfaction scores and benchmarks them against competitors likeP&G.You are tasked with analyzing the provided dataset to answer the following questions:1. Does Unilever’s average customer satisfaction score meet the minimum threshold of2. 75%?Is there no significant difference between Unilever’s overall average satisfaction scoreand P&G’s average satisfaction score?arrow_forward
- Need help answering wuestionarrow_forwardThe following table shows a data set containing information for 25 of the shadow stocks tracked by the American Association of Individual Investors (aaii.com, February 2002). Shadow stocks are common stocks of smaller companies that are not closely followed by Wall Street analysts. Click on the datafile logo to reference the data. DATA file Company DeWolfe Companies Exchange Ticker Symbol Market Cap ($ millions) Price/ Gross Profit Earnings Ratio Margin (%) AMEX DWL 36.4 8.4 36.7 North Coast Energy OTC NCEB 52.5 6.2 59.3 Hansen Natural Corp. OTC HANS 41.1 14.6 44.8 MarineMax, Inc. NYSE HZO 111.5 7.2 23.8 Nanometrics Incorporated OTC NANO 228.6 38.0 53.3 TeamStaff, Inc. OTC TSTF 92.1 33.5 4.1 Environmental Tectonics AMEX ETC 51.1 35.8 35.9 Measurement Specialties AMEX MSS 101.8 26.8 37.6 SEMCO Energy, Inc. NYSE SEN 193.4 18.7 23.6 Party City Corporation OTC PCTY 97.2 15.9 36.4 Embrex, Inc. OTC EMBX 136.5 18.9 59.5 Tech/Ops Sevcon, Inc. AMEX ΤΟ 23.2 20.7 35.7 ARCADIS NV OTC ARCAF 173.4…arrow_forwardThe following table shows a data set containing information for 25 of the shadow stocks tracked by the American Association of Individual Investors (aaii.com, February 2002). Shadow stocks are common stocks of smaller companies that are not closely followed by Wall Street analysts. Click on the datafile logo to reference the data. DATA file Company DeWolfe Companies Exchange AMEX Ticker Symbol Market Cap Price/ Gross Profit Earnings Margin ($ millions) Ratio (%) DWL 36.4 8.4 36.7 North Coast Energy OTC NCEB 52.5 6.2 59.3 Hansen Natural Corp. OTC HANS 41.1 14.6 44.8 MarineMax, Inc. NYSE HZO 111.5 7.2 23.8 Nanometrics Incorporated OTC NANO 228.6 38.0 53.3 TeamStaff, Inc. OTC TSTF 92.1 33.5 4.1 Environmental Tectonics AMEX ETC 51.1 35.8 35.9 Measurement Specialties AMEX MSS 101.8 26.8 37.6 SEMCO Energy, Inc. NYSE SEN 193.4 18.7 23.6 Party City Corporation OTC PCTY 97.2 15.9 36.4 Embrex, Inc. OTC EMBX 136.5 18.9 59.5 Tech/Ops Sevcon, Inc. AMEX ΤΟ 23.2 20.7 35.7 ARCADIS NV OTC ARCAF 173.4…arrow_forward
- The following data show the year to date percent change (YTD % Change) for 30 stock-market indexes from around the word (The Wall Street Journal, August 26, 2013). a. What index has the largest positive YTD % Change? Round your answer to once decimal place. index with a YTD % Change of % b. Using a class width of 5 beginning with -20 and going to 40, develop a frequency distribution for the data. YTD % Change Frequency -20 - -15 -15 - -10 -10 - -5 -5 - 0 0 - 5 5 - 10 10 - 15 15 - 20 20 - 25 30 - 35 c. 1. 2. 3. 4.arrow_forwardThe following data show the year to date percent change (YTD % Change) for 30 stock-market indexes from around the word (The Wall Street Journal, August 26, 2013). Click on the datafile logo to reference the data. DATA file Country Australia Index S&P/ASX200 YTD % Change 10.2 Belgium Bel-20 12.6 Brazil São Paulo Bovespa -14.4 Canada S&P/TSX Comp 2.6 Chile Santiago IPSA -16.3 China Shanghai Composite -9.3 Eurozone EURO Stoxx 10.0 France CAC 40 11.8 Germany DAX 10.6 Hong Kong Hang Seng -3.5 India S&P BSE Sensex -4.7 Israel Tel Aviv 1.3 Italy FTSE MIB 6.6 Japan Nikkei 31.4 Mexico IPC All-Share -6.4 Netherlands AEX 9.3 Singapore Straits Times -2.5 South Korea Kospi -6.4 Spain IBEX 35 6.4 Sweden Switzerland SX All Share 13.8 Swiss Market 17.4 Taiwan Weighted 2.3 U.K. FTSE 100 10.1 U.S. S&P 500 16.6 U.S. DJIA 14.5 U.S. Dow Jones Utility 6.6 U.S. Nasdaq 100 17.4 U.S. Nasdaq Composite 21.1 World DJ Global ex U.S. 4.2 World DJ Global Index 9.9 a. What index has the largest positive YTD %…arrow_forwardDescribe a three step process you choose to determine how many elementary schools there are in the city of 5 million people.arrow_forward

 Elementary Geometry for College StudentsGeometryISBN:9781285195698Author:Daniel C. Alexander, Geralyn M. KoeberleinPublisher:Cengage Learning

