
Concept explainers
Videos
The numbers of outstanding shares for 24 publicly traded companies are listed in the following table.
- a. Using the number of outstanding shares, summarize the companies with a frequency distribution.
- b. Display the frequency distribution with a frequency
polygon . - c. Create a cumulative frequency distribution of the outstanding shares.
- d. Display the cumulative frequency distribution with a cumulative frequency polygon.
- e. Based on the cumulative relative frequency distribution, 75% of the companies have less than “what number” of outstanding shares?
- f. Write a brief analysis of this group of companies based on your statistical summaries of “number of outstanding shares.”
a.
Construct a frequency distribution for the given table.
Answer to Problem 38CE
The frequency distribution for the publicly traded companies is given below:
| Outstanding shares |
Number of companies |
| 0–400 | 10 |
| 400–800 | 8 |
| 800–1,200 | 4 |
| 1,200–1,600 | 1 |
| 1,600–2,000 | 1 |
| Total | 24 |
Explanation of Solution
Selection of number of classes:
The “2 to the k rule” suggests that the number of classes is the smallest value of k, where
It is given that the data set consists of 24 observations. The value of k can be obtained as follows:
Here,
Therefore, the number of classes for the given data set is 5.
From the given data set, the maximum and minimum values are 1,957 and 22, respectively.
The formula for the class interval is given as follows:
where i is the class interval and k is the number of classes.
Therefore, the class interval for the given data can be obtained as follows:
In practice, the class interval size is usually rounded up to some convenient number. Therefore, the reasonable class interval is 400.
Frequency distribution:
The frequency table is a collection of mutually exclusive and exhaustive classes, which shows the number of observations in each class.
Since the minimum value is 22 and the class interval is 400, the first class would be 0–400. The frequency distribution for the publicly traded companies can be constructed as follows:
| Outstanding shares |
Number of companies |
| 0–400 | 10 |
| 400–800 | 8 |
| 800–1,200 | 4 |
| 1,200–1,600 | 1 |
| 1,600–2,000 | 1 |
| Total | 24 |
b.
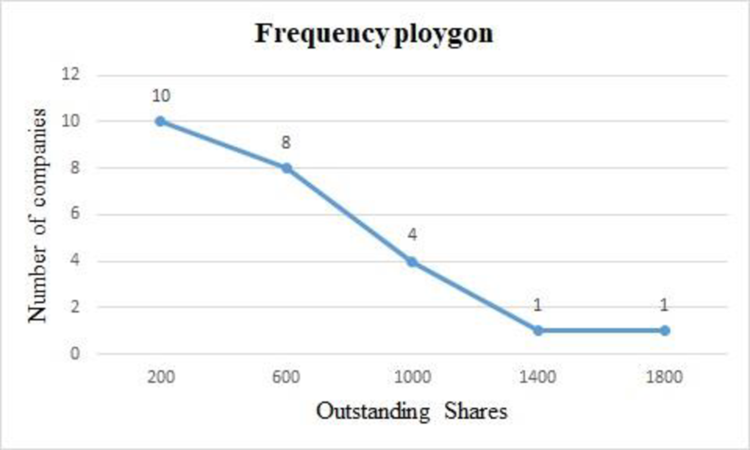
Create a frequency polygon for the frequency distribution.
Answer to Problem 38CE
The frequency polygon for the given data is as follows:
Explanation of Solution
For the given data set, the frequency table with mid-points of classes is obtained as follows:
| Outstanding shares | Mid-point |
Number of companies |
| 0–400 | 10 | |
| 400–800 | 8 | |
| 800–1,200 | 4 | |
| 1,200–1,600 | 1 | |
| 1,600–2,000 | 1 | |
| Total | 24 |
The frequency polygon for the given data can be drawn using EXCEL.
Step-by-step procedure to obtain the frequency polygon using EXCEL:
- Enter the column of midpoints along with the frequency column.
- Select the total data range with labels.
- Go to Insert > Charts > line chart.
- Select the appropriate line chart.
- Click OK.
c.
Create a cumulative frequency distribution for the given table.
Answer to Problem 38CE
The cumulative frequency distribution is given below:
| Outstanding shares |
Number of companies |
Cumulative frequency |
| 0–400 | 10 | 10 |
| 400–800 | 8 | 18 |
| 800–1,200 | 4 | 22 |
| 1,200–1,600 | 1 | 23 |
| 1,600–2,000 | 1 | 24 |
| Total | 24 |
Explanation of Solution
The cumulative frequency distribution for the frequency table in Part (a) can be constructed as follows:
| Outstanding shares |
Number of companies |
Cumulative frequency |
| 0–400 | 10 | 10 |
| 400–800 | 8 | |
| 800–1,200 | 4 | |
| 1,200–1,600 | 1 | |
| 1,600–2,000 | 1 | |
| Total | 24 |
d.
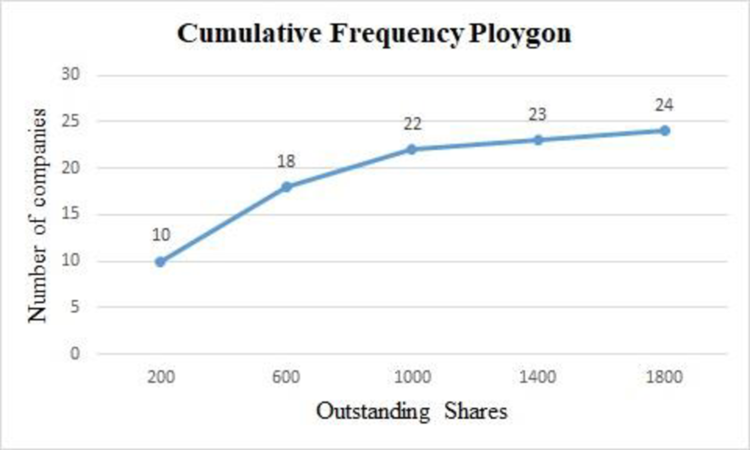
Create a cumulative frequency polygon for the frequency distribution.
Answer to Problem 38CE
The cumulative frequency polygon for the given data is as follows:
Explanation of Solution
For the given data set, the cumulative frequency table with mid-points of classes is obtained as follows:
| Outstanding shares | Mid-point |
Cumulative frequency for Number of companies |
| 0–400 | 10 | |
| 400–800 | 18 | |
| 800–1,200 | 22 | |
| 1,200–1,600 | 23 | |
| 1,600–2,000 | 24 |
The cumulative frequency polygon for the given data can be drawn using EXCEL.
Step-by-step procedure to obtain the frequency polygon using EXCEL:
- Enter the column of midpoints along with the cumulative frequency column.
- Select the total data range with labels.
- Go to Insert > Charts > line chart.
- Select the appropriate line chart.
- Click OK.
e.
Find the number of outstanding shares that 75% of the companies have below than it.
Answer to Problem 38CE
Approximately 75% of the companies have less than 600 outstanding shares.
Explanation of Solution
75% of the total 24 companies are 18 companies. From the given cumulative frequency polygon, the value on the outstanding shares axis corresponding to 18 on the number of companies’ axis is 600. Therefore, approximately 75% of the companies have less than 600 outstanding shares.
f.
Give an explanation about the analysis of the number of outstanding shares.
Explanation of Solution
From the cumulative frequency distribution in Part (d), 18 out of 24 companies have less than 600 million shares. Only 2 companies have more than 1200 million shares. Thus, the distribution of number of outstanding shares is positively skewed.
Want to see more full solutions like this?
Chapter 2 Solutions
Gen Combo Ll Statistical Techniques In Business And Economics; Connect Ac


- Clint, obviously not in college, sleeps an average of 8 hours per night with a standard deviation of 15 minutes. What's the chance of him sleeping between 7.5 and 8.5 hours on any given night? 0-(7-0) 200 91109s and doiw $20 (8-0) mol 8520 slang $199 galbrog seam side pide & D (newid se od poyesvig as PELEO PER AFTE editiw noudab temand van Czarrow_forwardTimes to complete a statistics exam have a normal distribution with a mean of 40 minutes and standard deviation of 6 minutes. Deshawn's time comes in at the 90th percentile. What percentage of the students are still working on their exams when Deshawn leaves?arrow_forwardSuppose that the weights of cereal boxes have a normal distribution with a mean of 20 ounces and standard deviation of half an ounce. A box that has a standard score of o weighs how much? syed by ilog ni 21arrow_forward
- Bob scores 80 on both his math exam (which has a mean of 70 and standard deviation of 10) and his English exam (which has a mean of 85 and standard deviation of 5). Find and interpret Bob's Z-scores on both exams to let him know which exam (if either) he did bet- ter on. Don't, however, let his parents know; let them think he's just as good at both subjects. algas 70) sering digarrow_forwardSue's math class exam has a mean of 70 with a standard deviation of 5. Her standard score is-2. What's her original exam score?arrow_forwardClint sleeps an average of 8 hours per night with a standard deviation of 15 minutes. What's the chance he will sleep less than 7.5 hours tonight? nut bow visarrow_forward
- Suppose that your score on an exam is directly at the mean. What's your standard score?arrow_forwardOne state's annual rainfall has a normal dis- tribution with a mean of 100 inches and standard deviation of 25 inches. Suppose that corn grows best when the annual rainfall is between 100 and 150 inches. What's the chance of achieving this amount of rainfall? wved now of sociarrow_forward13 Suppose that your exam score has a standard score of 0.90. Does this mean that 90 percent of the other exam scores are lower than yours?arrow_forward
- Bob's commuting times to work have a nor- mal distribution with a mean of 45 minutes and standard deviation of 10 minutes. How often does Bob get to work in 30 to 45 minutes?arrow_forwardBob's commuting times to work have a nor- mal distribution with a mean of 45 minutes and standard deviation of 10 minutes. a. What percentage of the time does Bob get to work in 30 minutes or less? b. Bob's workday starts at 9 a.m. If he leaves at 8 a.m., how often is he late?arrow_forwardSuppose that you want to put fat Fido on a weight-loss program. Before the program, his weight had a standard score of +2 com- pared to dogs of his breed/age, and after the program, his weight has a standard score of -2. His weight before the program was 150 pounds, and the standard deviation for the breed is 5 pounds. a. What's the mean weight for Fido's breed/ age? b. What's his weight after the weight-loss program?arrow_forward
 Holt Mcdougal Larson Pre-algebra: Student Edition...AlgebraISBN:9780547587776Author:HOLT MCDOUGALPublisher:HOLT MCDOUGAL
 Glencoe Algebra 1, Student Edition, 9780079039897...AlgebraISBN:9780079039897Author:CarterPublisher:McGraw Hill
 Big Ideas Math A Bridge To Success Algebra 1: Stu...AlgebraISBN:9781680331141Author:HOUGHTON MIFFLIN HARCOURTPublisher:Houghton Mifflin Harcourt
 Trigonometry (MindTap Course List)TrigonometryISBN:9781305652224Author:Charles P. McKeague, Mark D. TurnerPublisher:Cengage Learning
 College Algebra (MindTap Course List)AlgebraISBN:9781305652231Author:R. David Gustafson, Jeff HughesPublisher:Cengage Learning
 Functions and Change: A Modeling Approach to Coll...AlgebraISBN:9781337111348Author:Bruce Crauder, Benny Evans, Alan NoellPublisher:Cengage Learning