
Videos
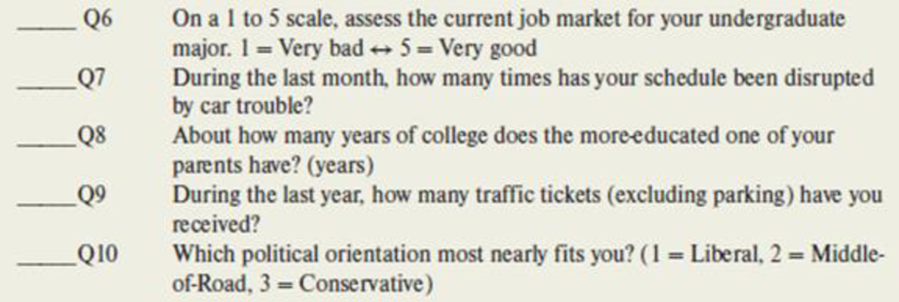
Below are five questions from a survey of MBA students Answers were written in the blank at the left of each question. For each question, state the data type (categorical, discrete numerical, or continuous numerical) and measurement level (nominal, ordinal, interval, ratio). Explain your reasoning. If there is doubt discuss the alternatives.
a.
Identify the data type as categorical, discrete numerical or continuous numerical and the measurement level as nominal, ordinal, interval or ratio for the given question.
Answer to Problem 34CE
The data type of the question “On a 1 to 5 scale, assess the current job market for your undergraduate major.” is categorical.
The question has ordinal measurement level.
Explanation of Solution
A survey is conducted on MBA students. The given question is, “On a 1 to 5 scale, assess the current job market for your undergraduate major. 1 = Very bad
Categorical data:
The type of data that naturally take non-numerical values, such as words that can classify or name the data points based on their quality, are called qualitative or categorical data. In order to facilitate the use of statistical methods on categorical data, a commonly used process used is coding, where each value of the categorical variable is coded or represented using a unique number.
Discrete numerical data:
The type of data that can take a countable number of distinct numerical or quantitative values is called a discrete numerical data.
Continuous numerical data:
The type of data that can take an uncountable or infinite number of numerical or quantitative values within any given interval is called a continuous numerical data.
The perception of an MBA student regarding the job market for their undergraduate major simply classifies or categorizes the parent. It does not take any numerical values naturally. Even if there are numerical values, mathematical operations cannot be applied on such values.
Hence, the data type of the question “On a 1 to 5 scale, assess the current job market for your undergraduate major.” is categorical.
Nominal measurement:
Nominal measurement is the most basic form of measurement that names or categorizes or classifies data. It is the weakest and easiest form of measurement.
Ordinal measurement:
Ordinal measurement is the measurement that ranks the data in a logical manner. It can be used when a natural ordering is present in the data to give the relative position of one object with respect to another. Numerical values can be assigned to the orders of the data, even when the data values are not naturally numerical. The properties of nominal measurement are applicable for ordinal measurement.
Interval measurement:
Interval measurement is the measurement that can be applied to data that naturally occur in the numerical form and counting of these values is logical. This scale of measurement does not have a meaningful “zero” value. However, the difference between any two points on the scale is meaningful. The operations of addition and subtraction on this scale are meaningful. The properties of nominal and ordinal measurements are applicable for interval measurement.
Ratio measurement:
Ratio measurement is the strongest form of measurement that can be applied to data that naturally occur in the numerical form and counting of these values is logical. This scale of measurement has a meaningful “zero” value. The operations of addition, subtraction, multiplication and division on this scale are meaningful. The properties of nominal, ordinal and interval measurements are applicable for ratio measurement.
The perception of an MBA student regarding the job market for their undergraduate major can be ordered from high to low or from low to high. Such perceptions can be ranked and assigned numerical values. However, application of mathematical operations is not logical on these values.
Hence, the question “On a 1 to 5 scale, assess the current job market for your undergraduate major.” has ordinal measurement level.
b.
Identify the data type as categorical, discrete numerical or continuous numerical and the measurement level as nominal, ordinal, interval or ratio for the given question.
Answer to Problem 34CE
The data type of the question “During the last month, how many times has your schedule been disrupted by car trouble?” is discrete numerical.
The question has ratio measurement level.
Explanation of Solution
The given variable is, “During the last month, how many times has your schedule been disrupted by car trouble?”
The number of times that the schedule of a student been disrupted by car trouble takes distinct numerical values, which are countable in nature. This number cannot take a fractional value.
Hence, the data type of the question “During the last month, how many times has your schedule been disrupted by car trouble?” is discrete numerical.
The number of times of disruption can be counted. Moreover, the value zero is also logical as the number of times of disruption faced by a student. The operations of addition, subtraction, multiplication and division can be logically performed on this variable.
Hence, the question “During the last month, how many times has your schedule been disrupted by car trouble?” has ratio measurement level.
c.
Identify the data type as categorical, discrete numerical or continuous numerical and the measurement level as nominal, ordinal, interval or ratio for the given question.
Answer to Problem 34CE
The data type of the question “About how many years of college does the more-educated one of your parents have?” is continuous numerical.
The question has ratio measurement level.
Explanation of Solution
The given variable is, “About how many years of college does the more-educated one of your parents have? (years)”.
The number of years of college education received by the parent of a student can take infinite values within a given interval.
Hence, the data type of the question “About how many years of college does the more-educated one of your parents have?” is continuous numerical.
The number of years can be counted. Moreover, the value zero is also logical as the number of years of college education received by the parent of a student. The operations of addition, subtraction, multiplication and division can be logically performed on this variable.
Hence, the question “About how many years of college does the more-educated one of your parents have?” has ratio measurement level.
d.
Identify the data type as categorical, discrete numerical or continuous numerical and the measurement level as nominal, ordinal, interval or ratio for the given question.
Answer to Problem 34CE
The data type of the question “During the last year, how many traffic tickets (excluding parking) have you received?” is discrete numerical.
The question has ratio measurement level.
Explanation of Solution
The given variable is, “During the last year, how many traffic tickets (excluding parking) have you received?”
The number of traffic tickets received by a student takes distinct numerical values, which are countable in nature. This number cannot take a fractional value.
Hence, the data type of the question “During the last year, how many traffic tickets (excluding parking) have you received?” is discrete numerical.
The number of traffic tickets received can be counted. Moreover, the value zero is also logical as the traffic tickets. The operations of addition, subtraction, multiplication and division can be logically performed on this variable.
Hence, the question “During the last year, how many traffic tickets (excluding parking) have you received?” has ratio measurement level.
e.
Identify the data type as categorical, discrete numerical or continuous numerical and the measurement level as nominal, ordinal, interval or ratio for the given question.
Answer to Problem 34CE
The data type of the question “Which political orientation most nearly fits you?” is categorical.
The question has nominal measurement level.
Explanation of Solution
The given variable is, “Which political orientation most nearly fits you? (1 = Liberal, 2 = Middle-of- Road, 3 = Conservative)”.
The political orientation of a student simply classifies or categorizes the student. It does not take any numerical values naturally.
Hence, the data type of the question “Which political orientation most nearly fits you?” is categorical.
The political orientation of a student classifies or categorizes the student. Even when numbers are assigned to such affiliations, these cannot be ranked in a logical order. Moreover, it is not logical to perform mathematical operations on such numbers.
Hence, the question “Which political orientation most nearly fits you?” has nominal measurement level.
Want to see more full solutions like this?
Chapter 2 Solutions
Applied Statistics in Business and Economics


- Question 5. We consider a put option with strike price K and expiration T. This option is priced using a 1-period CRR model. We consider r > 0, and σ > 0 very large. What is the approximate price of the option? In other words, what is the limit of the price of the option as σ∞. (Briefly justify your answer.)arrow_forwardQuestion 6. You collect daily data for the stock of a company Z over the past 4 months (i.e. 80 days) and calculate the log-returns (yk)/(-1. You want to build a CRR model for the evolution of the stock. The expected value and standard deviation of the log-returns are y = 0.06 and Sy 0.1. The money market interest rate is r = 0.04. Determine the risk-neutral probability of the model.arrow_forwardSeveral markets (Japan, Switzerland) introduced negative interest rates on their money market. In this problem, we will consider an annual interest rate r < 0. We consider a stock modeled by an N-period CRR model where each period is 1 year (At = 1) and the up and down factors are u and d. (a) We consider an American put option with strike price K and expiration T. Prove that if <0, the optimal strategy is to wait until expiration T to exercise.arrow_forward
- We consider an N-period CRR model where each period is 1 year (At = 1), the up factor is u = 0.1, the down factor is d = e−0.3 and r = 0. We remind you that in the CRR model, the stock price at time tn is modeled (under P) by Sta = So exp (μtn + σ√AtZn), where (Zn) is a simple symmetric random walk. (a) Find the parameters μ and σ for the CRR model described above. (b) Find P Ste So 55/50 € > 1). StN (c) Find lim P 804-N (d) Determine q. (You can use e- 1 x.) Ste (e) Find Q So (f) Find lim Q 004-N StN Soarrow_forwardIn this problem, we consider a 3-period stock market model with evolution given in Fig. 1 below. Each period corresponds to one year. The interest rate is r = 0%. 16 22 28 12 16 12 8 4 2 time Figure 1: Stock evolution for Problem 1. (a) A colleague notices that in the model above, a movement up-down leads to the same value as a movement down-up. He concludes that the model is a CRR model. Is your colleague correct? (Explain your answer.) (b) We consider a European put with strike price K = 10 and expiration T = 3 years. Find the price of this option at time 0. Provide the replicating portfolio for the first period. (c) In addition to the call above, we also consider a European call with strike price K = 10 and expiration T = 3 years. Which one has the highest price? (It is not necessary to provide the price of the call.) (d) We now assume a yearly interest rate r = 25%. We consider a Bermudan put option with strike price K = 10. It works like a standard put, but you can exercise it…arrow_forwardIn this problem, we consider a 2-period stock market model with evolution given in Fig. 1 below. Each period corresponds to one year (At = 1). The yearly interest rate is r = 1/3 = 33%. This model is a CRR model. 25 15 9 10 6 4 time Figure 1: Stock evolution for Problem 1. (a) Find the values of up and down factors u and d, and the risk-neutral probability q. (b) We consider a European put with strike price K the price of this option at time 0. == 16 and expiration T = 2 years. Find (c) Provide the number of shares of stock that the replicating portfolio contains at each pos- sible position. (d) You find this option available on the market for $2. What do you do? (Short answer.) (e) We consider an American put with strike price K = 16 and expiration T = 2 years. Find the price of this option at time 0 and describe the optimal exercising strategy. (f) We consider an American call with strike price K ○ = 16 and expiration T = 2 years. Find the price of this option at time 0 and describe…arrow_forward
- 2.2, 13.2-13.3) question: 5 point(s) possible ubmit test The accompanying table contains the data for the amounts (in oz) in cans of a certain soda. The cans are labeled to indicate that the contents are 20 oz of soda. Use the sign test and 0.05 significance level to test the claim that cans of this soda are filled so that the median amount is 20 oz. If the median is not 20 oz, are consumers being cheated? Click the icon to view the data. What are the null and alternative hypotheses? OA. Ho: Medi More Info H₁: Medi OC. Ho: Medi H₁: Medi Volume (in ounces) 20.3 20.1 20.4 Find the test stat 20.1 20.5 20.1 20.1 19.9 20.1 Test statistic = 20.2 20.3 20.3 20.1 20.4 20.5 Find the P-value 19.7 20.2 20.4 20.1 20.2 20.2 P-value= (R 19.9 20.1 20.5 20.4 20.1 20.4 Determine the p 20.1 20.3 20.4 20.2 20.3 20.4 Since the P-valu 19.9 20.2 19.9 Print Done 20 oz 20 oz 20 oz 20 oz ce that the consumers are being cheated.arrow_forwardT Teenage obesity (O), and weekly fast-food meals (F), among some selected Mississippi teenagers are: Name Obesity (lbs) # of Fast-foods per week Josh 185 10 Karl 172 8 Terry 168 9 Kamie Andy 204 154 12 6 (a) Compute the variance of Obesity, s²o, and the variance of fast-food meals, s², of this data. [Must show full work]. (b) Compute the Correlation Coefficient between O and F. [Must show full work]. (c) Find the Coefficient of Determination between O and F. [Must show full work]. (d) Obtain the Regression equation of this data. [Must show full work]. (e) Interpret your answers in (b), (c), and (d). (Full explanations required). Edit View Insert Format Tools Tablearrow_forwardThe average miles per gallon for a sample of 40 cars of model SX last year was 32.1, with a population standard deviation of 3.8. A sample of 40 cars from this year’s model SX has an average of 35.2 mpg, with a population standard deviation of 5.4. Find a 99 percent confidence interval for the difference in average mpg for this car brand (this year’s model minus last year’s).Find a 99 percent confidence interval for the difference in average mpg for last year’s model minus this year’s. What does the negative difference mean?arrow_forward
- A special interest group reports a tiny margin of error (plus or minus 0.04 percent) for its online survey based on 50,000 responses. Is the margin of error legitimate? (Assume that the group’s math is correct.)arrow_forwardSuppose that 73 percent of a sample of 1,000 U.S. college students drive a used car as opposed to a new car or no car at all. Find an 80 percent confidence interval for the percentage of all U.S. college students who drive a used car.What sample size would cut this margin of error in half?arrow_forwardYou want to compare the average number of tines on the antlers of male deer in two nearby metro parks. A sample of 30 deer from the first park shows an average of 5 tines with a population standard deviation of 3. A sample of 35 deer from the second park shows an average of 6 tines with a population standard deviation of 3.2. Find a 95 percent confidence interval for the difference in average number of tines for all male deer in the two metro parks (second park minus first park).Do the parks’ deer populations differ in average size of deer antlers?arrow_forward
 Holt Mcdougal Larson Pre-algebra: Student Edition...AlgebraISBN:9780547587776Author:HOLT MCDOUGALPublisher:HOLT MCDOUGAL
 Glencoe Algebra 1, Student Edition, 9780079039897...AlgebraISBN:9780079039897Author:CarterPublisher:McGraw Hill
 Big Ideas Math A Bridge To Success Algebra 1: Stu...AlgebraISBN:9781680331141Author:HOUGHTON MIFFLIN HARCOURTPublisher:Houghton Mifflin Harcourt
 Algebra: Structure And Method, Book 1AlgebraISBN:9780395977224Author:Richard G. Brown, Mary P. Dolciani, Robert H. Sorgenfrey, William L. ColePublisher:McDougal Littell
 Functions and Change: A Modeling Approach to Coll...AlgebraISBN:9781337111348Author:Bruce Crauder, Benny Evans, Alan NoellPublisher:Cengage Learning