
Whether figures are important effect for companies
Agreement The purpose of a life-cycle cost is one that goes through the entire process from start to finish. The graph below shows different stages in product life cycle.
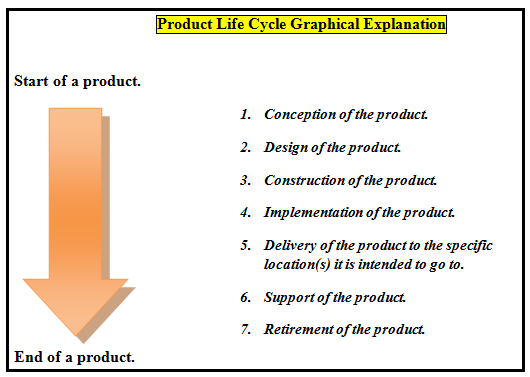
As one can see, there are a number of stages that a product has to go through in order for a cost to qualify as a product life cycle cost. The concepts of age and life cycle apply to products in much the same way as a product life cycle cost. The concepts of age and life cycle apply to products in much the same way as they apply to humans. A product begins as an infant with an idea, grows up and builds momentum over time, matures, and then deteriorates before sadly passing away.
Refer to the figure. The first graphic is the cumulative life cycle of dollars spent on a good, product or a service. On a closer look, it resembles to a partridge. As the product goes through the processes, the amount of money committed is much higher than the costs that are spent for the product. However, as it nears the retirement or declining time of the product, both the costs committed as well as spent are nearly equal before they are fully exhausted.
There are several takeaways that one get from the graph. First, then costs that are committed to the product are much higher than those in the latter phases. The second takeaway is that the companies that are developing the goods, products, or services want to maximize the value per dollar spent on the product as early as possible. Thus, the benefits are also not realized until the product is produced in some quantity. Even then, it usually take s extra time for the benefits to be realized.
The second figure focuses on the ease of making changes to the product, good, or service. Here, as the product passes through different phases, the cost to implement changes increases to the point where it equals to the cost. The production phase is the optimal time to make changes because the adjustment costs are roughly half the cost of the product.
The flip side of the graphic is the ease to change the product. It is much more difficult to change the product in the earlier phases because there are many unknown consequences that could arise due to changes implemented. However, as the time goes on, the ease to make changes increases as well. Once the product is retired, changes can then be made prior to the creation of a new product replacement.
Conclusion:
In short, there are certain takeaways from this comparative analysis of the two different graphics. The first is the intention to show that changes made earlier are less expensive to implement. The second takeaway is that the quality of the product, goods, and services will be better when these are made sooner in the process. Finally, integrated, cross-functional, and enterprise-wide approaches to the product design and execution will be better for companies at present, than rash major changes throughout the design process.
Want to see the full answer?
Check out a sample textbook solution
Chapter 2 Solutions
ENGINEERING ECONOMIC ENHANCED EBOOK

- 13:53 APP 簸洛瞭對照 Vo 56 5G 48% 48% atheva.cc/index/index/index.html The Most Trusted, Secure, Fast, Reliable Cryptocurrency Exchange Get started with the easiest and most secure platform to buy, sell, trade, and earn Cryptocurrency Balance:0.00 Recharge Withdraw Message About us BTC/USDT ETH/USDT EOS/USDT 83241.12 1841.50 83241.12 +1.00% +0.08% +1.00% Operating norms Symbol Latest price 24hFluctuation B BTC/USDT 83241.12 +1.00% ETH/USDT 1841.50 +0.08% B BTC/USD illı 83241.12 +1.00% Home Markets Trade Record Mine О <arrow_forwardThe production function of a firm is described by the following equation Q=10,000L-3L2 where Lstands for the units of labour.a) Draw a graph for this equation. Use the quantity produced in the y-axis, and the units of labour inthe x-axis. b) What is the maximum production level? c) How many units of labour are needed at that point?arrow_forwardDon't use ai to answer I will report you answerarrow_forward
- how to solve the attachment?arrow_forwardProblem 3-ABC Challenges: Attrition, Balance and ComplianceCan television inform people about public affairs? Political scientists Bethany Albertson and Adria Lawrence (2009) conducted an experiment in which they randomly assigned people to treatment and control groups to evaluate the effect of watching TV on a person’s information level. Those assigned to the treatment group were told to watch a specific television broadcast and were later asked questions related to what they watched. Those in the controlgroup were not shown the TV broadcast but were asked questions related to the material in the TV broadcast. The dataset contains the following variables: : Dummy variable which =1 if a person reads news and 0 otherwise. : interest in political affairs (not interested=1 to very interested=4) : years of education : female dummy variable (female=1; male=0) : family income in thousands of dollars : information level (low information level=1 to high information level=4) =1 if the…arrow_forwardProblem 2-Experiments/Randomized Control Trial Suppose you are interested in studying the effect of academic counselling on the years it takes for a student to obtain an undergraduate degree. You conduct a randomized control trial to answer the question. You randomly assign 2500 individuals in a university in New York to receive academic counselling and 2500 students to not receive any academic counselling. a. Which people are a part of the treatment group and which people are a part of thecontrol group? b. What regression will you run? Define the variables where required. c. Suppose you estimate = -0.3. Interpret it. d. You test for balance using the variables mentioned in the table below. Based on the results do you think that the treatment and control group are balanced? If your answer is “yes” then explain why. If your answer is “no”, then explain why and mention how will you address the issue of imbalance. e. Suppose that some unmotivated students in the control group decided to…arrow_forward
- How to calculate total cost?arrow_forwardProblem 1-Experiments/Randomized Control TrialSuppose you are interested in studying the effect of being a part of the labor union on anindividual’s hourly wage.You collect data on 1000 people and run the following regression. where is a dummy variable which is equal t to 1 for people who are a part of labor union and0 for others. a. Suppose you estimate . Interpret b. Do you think is biased or unbiased? Explain. Now suppose you conduct a randomized control trial to answer the same question. Yourandomly assign some individuals to be a part of the labor union and others to not be a partof the labor union. The first step you take is to ensure that the randomization was donecorrectly. Then you estimate the following equation: =1 if the student is assigned to be a part of Labor Union=0 if the student is assigned to not be a part of Labor Union c. Why is it important to ensure that the randomization is done correctly? d. Name any two variables that you can use to test if Treatment and…arrow_forwardWhat is kiosk?arrow_forward

 Principles of Economics (12th Edition)EconomicsISBN:9780134078779Author:Karl E. Case, Ray C. Fair, Sharon E. OsterPublisher:PEARSON
 Engineering Economy (17th Edition)EconomicsISBN:9780134870069Author:William G. Sullivan, Elin M. Wicks, C. Patrick KoellingPublisher:PEARSON
 Principles of Economics (MindTap Course List)EconomicsISBN:9781305585126Author:N. Gregory MankiwPublisher:Cengage Learning
 Managerial Economics: A Problem Solving ApproachEconomicsISBN:9781337106665Author:Luke M. Froeb, Brian T. McCann, Michael R. Ward, Mike ShorPublisher:Cengage Learning
 Managerial Economics & Business Strategy (Mcgraw-...EconomicsISBN:9781259290619Author:Michael Baye, Jeff PrincePublisher:McGraw-Hill Education