Concept explainers
Videos
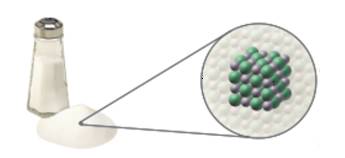
Consider the photograph and illustrations of table salt. Do they include a model? Do they include a depiction of matter at the macroscopic, microscopic, and/or particulate levels? Explain your answers.
To predict the given photograph and illustrations of table salt, identify the depiction of matter at the macroscopic, microscopic, and/or particulate levels with explanation.
Interpretation:
Macroscopic, microscopic and particulate forms of matter are the three forms of matter.
Macroscopic can be viewed by the naked eyes, but we will be able to view microscopic form only by an optical microscope or electron microscope. Matter at the particulate level is so small that even with electron microscope it is really very difficult see them. Scientist use model to understand matter at particulate level. Models is representation of something
Concept introduction:
Answer to Problem 2.1TC
The art depicts a model of table salt at the particulate level. The photograph shows the macroscopic level
Explanation of Solution
Macroscopic, microscopic and particulate forms of matter are the three forms of matter.
Macroscopic can be viewed by the naked eyes, but we will be able to view microscopic form only by an optical microscope or electron microscope. Matter at the particulate level is so small that even with electron microscope it is really very difficult see them. Scientist use model to understand matter at particulate level. Models are representation of something. From the above statement we can say that the art depicts a model of table salt at the particulate level. The photograph shows at the macroscopic level
Thus the art depicts a model of table salt at the particulate level. The photograph shows the macroscopic level
Want to see more full solutions like this?
Chapter 2 Solutions
Introductory Chemistry: An Active Learning Approach


- Identify the compound with the longest carbon - nitrogen bond. O CH3CH2CH=NH O CH3CH2NH2 CH3CH2C=N CH3CH=NCH 3 The length of all the carbon-nitrogen bonds are the samearrow_forwardIdentify any polar covalent bonds in epichlorohydrin with S+ and 8- symbols in the appropriate locations. Choose the correct answer below. Η H's+ 6Η Η Η Η Η Ηδ Η Ο Ο HH +Η Η +Η Η Η -8+ CIarrow_forwardH H:O::::H H H HH H::O:D:D:H HH HH H:O:D:D:H .. HH H:O:D:D:H H H Select the correct Lewis dot structure for the following compound: CH3CH2OHarrow_forward
- Rank the following compounds in order of decreasing boiling point. ннннн -С-С-Н . н-с- ННННН H ΗΤΗ НННН TTTĪ н-с-с-с-с-о-н НННН НН C' Н н-с-с-с-с-н НН || Ш НННН H-C-C-C-C-N-H ННННН IVarrow_forwardRank the following compounds in order of decreasing dipole moment. |>||>||| ||>|||>| |>|||>|| |||>||>| O ||>>||| H F H F H c=c || H c=c F F IIIarrow_forwardchoose the description that best describes the geometry for the following charged species ch3-arrow_forward
- Why isn't the ketone in this compound converted to an acetal or hemiacetal by the alcohol and acid?arrow_forwardWhat is the approximate bond angle around the nitrogen atom? HNH H Harrow_forwardOH 1. NaOCH2CH3 Q 2. CH3CH2Br (1 equiv) H3O+ Select to Draw 1. NaOCH2 CH3 2. CH3Br (1 equiv) heat Select to Edit Select to Drawarrow_forward
- Complete and balance the following half-reaction in acidic solution. Be sure to include the proper phases for all species within the reaction. S₂O₃²⁻(aq) → S₄O₆²⁻(aq)arrow_forwardQ Select to Edit NH3 (CH3)2CHCI (1 equiv) AICI 3 Select to Draw cat. H2SO4 SO3 (1 equiv) HO SOCl2 pyridine Select to Edit >arrow_forwardComplete and balance the following half-reaction in basic solution. Be sure to include the proper phases for all species within the reaction. Zn(s) → Zn(OH)₄²⁻(aq)arrow_forward
 Introductory Chemistry: An Active Learning Approa...ChemistryISBN:9781305079250Author:Mark S. Cracolice, Ed PetersPublisher:Cengage Learning
 Chemistry: The Molecular ScienceChemistryISBN:9781285199047Author:John W. Moore, Conrad L. StanitskiPublisher:Cengage Learning
 Chemistry: Matter and ChangeChemistryISBN:9780078746376Author:Dinah Zike, Laurel Dingrando, Nicholas Hainen, Cheryl WistromPublisher:Glencoe/McGraw-Hill School Pub Co
 Introductory Chemistry: A FoundationChemistryISBN:9781337399425Author:Steven S. Zumdahl, Donald J. DeCostePublisher:Cengage Learning
 World of Chemistry, 3rd editionChemistryISBN:9781133109655Author:Steven S. Zumdahl, Susan L. Zumdahl, Donald J. DeCostePublisher:Brooks / Cole / Cengage Learning
 ChemistryChemistryISBN:9781305957404Author:Steven S. Zumdahl, Susan A. Zumdahl, Donald J. DeCostePublisher:Cengage Learning