
Videos
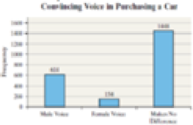
Effective Commercial Harris Interactive conducted a poll of U.S. adults and asked, “When there is a voiceover in a commercial, which type of voice is more likely to sell me a car?” Results of the survey are in the bar graph.
- a. How many participants were in the survey?
- b. What is the relative frequency of the respondents who indicated that it made no difference which voice they heard?
- c. Redraw the graph as a Pareto chart.
- d. Research automotive commercials. Do you believe that auto manufacturers use the results of this survey when developing their commercials?
a.
To find: The number of participants in the survey.
Answer to Problem 1RE
There are 2,216 participants in the survey.
Explanation of Solution
Given info:
Harris interactive conducted a survey and asked U.S adults about their opinion of voice of gender in selling a car that which voice will make them to sell the car. And the bar chart is drawn based on their response.
Calculation:
In the survey, there are 3 categories. That is, the people who get impressed by male voice and the people who get impressed by female voice, and the people who have no difference.
The total number of participants is as follows:
Substitute “614” for the number of participants who answered “male voice”, “154” for those who answered “female voice”, and “1,448” for those who had no difference.
Thus, the number of participants in the survey is 2,216.
b.
To find: The relative frequency of participants who responded to that voice difference did not make a change.
Answer to Problem 1RE
The relative frequency of participants who responded to no difference of voice is 0.653.
Explanation of Solution
Calculation:
The general formula for the relative frequency is as follows:
Substituting the number of participants who did not have any difference with voice “1,448”, as the frequency and total number of participants “2,216” as total frequency in relative frequency.
Thus, the relative frequency of response that voice did not make any change is 0.653.
c.
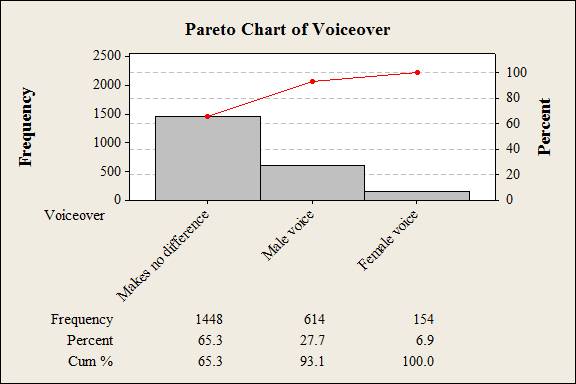
To construct: A Pareto chart.
Answer to Problem 1RE
Output obtained from MINITAB is given below:
Explanation of Solution
Calculation:
Software Procedure:
Step-by-step procedure to draw the Pareto chart using the MINITAB software:
- Choose Stat > Quality Tools > Pareto Chart.
- Enter the corresponding column in Defects or attribute data in.
- In Frequencies in, enter a frequency.
- Click OK.
Observation:
The Pareto chart shows that the maximum number of respondents does not have any difference with the gender voice, and the minimum number of people is more likely to sell if it is a female voice.
d.
To describe: The opinion that whether the auto manufacturers will use the survey results or not.
Answer to Problem 1RE
Yes, the auto manufacturers use the results of this survey when developing their commercials.
Explanation of Solution
Answers will vary. One of the possible answers is given below:
Yes, may be auto manufacturers will use these results for their better benefits while developing their commercials.
Want to see more full solutions like this?
Chapter 2 Solutions
Fundamentals of Statistics (5th Edition)


- A company found that the daily sales revenue of its flagship product follows a normal distribution with a mean of $4500 and a standard deviation of $450. The company defines a "high-sales day" that is, any day with sales exceeding $4800. please provide a step by step on how to get the answers in excel Q: What percentage of days can the company expect to have "high-sales days" or sales greater than $4800? Q: What is the sales revenue threshold for the bottom 10% of days? (please note that 10% refers to the probability/area under bell curve towards the lower tail of bell curve) Provide answers in the yellow cellsarrow_forwardFind the critical value for a left-tailed test using the F distribution with a 0.025, degrees of freedom in the numerator=12, and degrees of freedom in the denominator = 50. A portion of the table of critical values of the F-distribution is provided. Click the icon to view the partial table of critical values of the F-distribution. What is the critical value? (Round to two decimal places as needed.)arrow_forwardA retail store manager claims that the average daily sales of the store are $1,500. You aim to test whether the actual average daily sales differ significantly from this claimed value. You can provide your answer by inserting a text box and the answer must include: Null hypothesis, Alternative hypothesis, Show answer (output table/summary table), and Conclusion based on the P value. Showing the calculation is a must. If calculation is missing,so please provide a step by step on the answers Numerical answers in the yellow cellsarrow_forward
 Glencoe Algebra 1, Student Edition, 9780079039897...AlgebraISBN:9780079039897Author:CarterPublisher:McGraw Hill
 Holt Mcdougal Larson Pre-algebra: Student Edition...AlgebraISBN:9780547587776Author:HOLT MCDOUGALPublisher:HOLT MCDOUGAL

 College Algebra (MindTap Course List)AlgebraISBN:9781305652231Author:R. David Gustafson, Jeff HughesPublisher:Cengage Learning
 Big Ideas Math A Bridge To Success Algebra 1: Stu...AlgebraISBN:9781680331141Author:HOUGHTON MIFFLIN HARCOURTPublisher:Houghton Mifflin Harcourt