
ALEKS 360 ELEM STATISTICS
10th Edition
ISBN: 9781264241385
Author: Bluman
Publisher: MCG
expand_more
expand_more
format_list_bulleted
Concept explainers
Videos
Textbook Question
Chapter 2, Problem 1CTC
The Great Lakes Shown are various statistics about the Great Lakes. Using appropriate graphs (your choice) and summary statements, write a report analyzing the data.
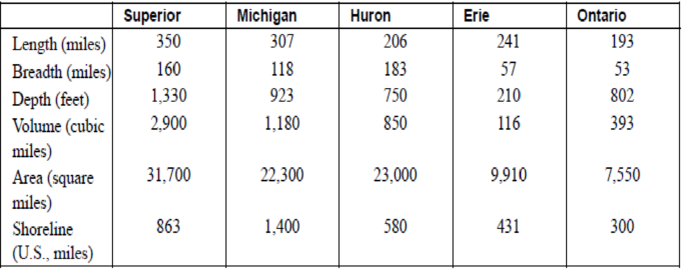
Source: The World Almanac and Book of Facts.
Expert Solution & Answer
Want to see the full answer?
Check out a sample textbook solution
Students have asked these similar questions
14
A survey is conducted to determine whether
would prefer to work at home, if given the
20 office employees of a certain company
chance. The overall results are shown in the
first bar graph, and the results broken down
by gender are presented in the second.
a. Interpret the results of each graph.
b. Discuss the added value in including gen-
der in the second bar graph. (The second
bar graph in this problem is called a side
by side bar graph and is often used to
show results broken down by two or more
variables.)
c. Compare the side by side bar graph with
the two pie charts that you made for
Question 6. Which of the two methods is
best for comparing two groups, in your
opinion?
A
Would you prefer to work at home? (n=20)
60
50
40
Percent
20
30
20
30
10
0
No
Yes
Prefer to work at home? (10 males, 10 females)
80
Percent
60
00
40
40
20-
No
Yes
No
Yes
Female
Male
Frequency
12
Suppose that a random sample of 270 gradu-
ating seniors are asked what their immediate
priorities are, including whether buying a
house is a priority. The results are shown in
the following bar graph.
a. The bar graph is misleading; explain why.
b. Make a new bar graph that more fairly
presents the results.
Is Buying a House a Priority?
300
250
200
150
100
50
0
Yes
No
Undecided
Frequency
11
A polling organization wants to find out
what voters think of Issue X. It chooses a
random sample of voters and asks them
for their opinions of Issue X: yes, no, or
no opinion. I organize the results in the
following bar graph.
a. Make a frequency table of these results
(including the total number).
brocb. Evaluate the bar graph as to whether it
biz s b fairly represents the results.
of beau no
STORE TO OW! vd wob spind
550
540
500
vd
480
420
360
300
250
240
Yes
No
Undecided
Opinion on Issue X
Chapter 2 Solutions
ALEKS 360 ELEM STATISTICS
Ch. 2.1 - Ages of Presidents at Inauguration The data...Ch. 2.1 - List five reasons for organizing data into a...Ch. 2.1 - Name the three types of frequency distributions,...Ch. 2.1 - How many classes should frequency distributions...Ch. 2.1 - What are open-ended frequency distributions? Why...Ch. 2.1 - For Exercises 58, find the class boundaries,...Ch. 2.1 - For Exercises 58, find the class boundaries,...Ch. 2.1 - For Exercises 58, find the class boundaries,...Ch. 2.1 - For Exercises 58, find the class boundaries,...Ch. 2.1 - For Exercises 912, show frequency distributions...
Ch. 2.1 - For Exercises 912, show frequency distributions...Ch. 2.1 - For Exercises 912, show frequency distributions...Ch. 2.1 - For Exercises 912, show frequency distributions...Ch. 2.1 - Favorite Coffee Flavor A survey was taken asking...Ch. 2.1 - Trust in Internet Information A survey was taken...Ch. 2.1 - Eating at Fast Food Restaurants A survey was taken...Ch. 2.1 - Ages of Dogs The ages of 20 dogs in a pet shelter...Ch. 2.1 - Maximum Wind Speeds The data show the maximum wind...Ch. 2.1 - Stories in the Worlds Tallest Buildings The number...Ch. 2.1 - Ages of Declaration of Independence Signers The...Ch. 2.1 - Salaries of Governors Here are the salaries (in...Ch. 2.1 - Charity Donations A random sample of 30 large...Ch. 2.1 - Unclaimed Expired Prizes The number of unclaimed...Ch. 2.1 - Scores in the Rose Bowl The data show the scores...Ch. 2.1 - Consumption of Natural Gas Construct a frequency...Ch. 2.1 - Average Wind Speeds A sample of 40 large cities...Ch. 2.1 - Percentage of People Who Completed 4 or More Years...Ch. 2.1 - JFK Assassination A researcher conducted a survey...Ch. 2.1 - The Value of Pi The ratio of the circumference of...Ch. 2.2 - Selling Real Estate Assume you are a realtor in...Ch. 2.2 - Do Students Need Summer Development? For 108...Ch. 2.2 - Bear Kills The number of bears killed in 2014 for...Ch. 2.2 - Pupils Per Teacher The average number of pupils...Ch. 2.2 - Number of College Faculty The number of faculty...Ch. 2.2 - Railroad Crossing Accidents The data show the...Ch. 2.2 - NFL Salaries The salaries (in millions of dollars)...Ch. 2.2 - Suspension Bridges Spans The following frequency...Ch. 2.2 - Costs of Utilities The frequency distribution...Ch. 2.2 - Air Pollution One of the air pollutants that is...Ch. 2.2 - Making the Grade The frequency distributions shown...Ch. 2.2 - Blood Glucose Levels The frequency distribution...Ch. 2.2 - Waiting Times The frequency distribution shows the...Ch. 2.2 - Construct a histogram, frequency polygon, and...Ch. 2.2 - Construct a histogram, frequency polygon, and...Ch. 2.2 - Construct a histogram, frequency polygon, and...Ch. 2.2 - Construct a histogram, frequency polygon, and...Ch. 2.2 - Home Runs The data show the most number of home...Ch. 2.2 - Protein Grams in Fast Food The amount of protein...Ch. 2.2 - Using the histogram shown here, do the following....Ch. 2.2 - Using the results from Exercise 19. answer these...Ch. 2.2 - Math SAT Scores Shown is an ogive depicting the...Ch. 2.3 - Applying the Concepts 23 Causes of Accidental...Ch. 2.3 - Tech Company Employees Construct a vertical and...Ch. 2.3 - Worldwide Sales of Fast Foods The worldwide sales...Ch. 2.3 - Gulf Coastlines Construct a Pareto chart for the...Ch. 2.3 - Roller Coaster Mania The World Roller Coaster...Ch. 2.3 - Online Ad Spending The amount spent (in billions...Ch. 2.3 - Violent Crimes The number of all violent crimes...Ch. 2.3 - U.S. Licensed Drivers 70 or Older Draw a time...Ch. 2.3 - Valentines Day Spending The data show the average...Ch. 2.3 - Credit Cards Draw and analyze a pie graph for the...Ch. 2.3 - Reasons We Travel The following data are based on...Ch. 2.3 - Kids and Guns The following data show where...Ch. 2.3 - Colors of Automobiles The popular car colors are...Ch. 2.3 - Ages of Football Players The data show the ages of...Ch. 2.3 - Teacher Strikes In Pennsylvania the numbers of...Ch. 2.3 - Years of Experience The data show the number of...Ch. 2.3 - Commuting Times Fifty off-campus students were...Ch. 2.3 - Home Run Club There are 43 Major League baseball...Ch. 2.3 - Calories in Salad Dressings A listing of calories...Ch. 2.3 - Length of Major Rivers The data show the lengths...Ch. 2.3 - Math and Reading Achievement Scores The math and...Ch. 2.3 - State which type of graph (Pareto chart, time...Ch. 2.3 - State which graph (Pareto chart, time series...Ch. 2.3 - U.S. Health Dollar The U.S. health dollar is spent...Ch. 2.3 - Prob. 24ECh. 2.3 - Cost of Milk The graph shows the increase in the...Ch. 2.3 - U.S. Population by Age The following information...Ch. 2.3 - Chicago Homicides Draw and compare two time series...Ch. 2.3 - Trip Reimbursements The average amount requested...Ch. 2 - How People Get Their News The Brunswick Research...Ch. 2 - Mens World Hockey Champions The United States won...Ch. 2 - BUN Count The blood urea nitrogen (BUN) count of...Ch. 2 - Wind Speed The data show the average wind speed...Ch. 2 - Waterfall Heights The data show the heights (in...Ch. 2 - Ages of the Vice Presidents at the Time of Their...Ch. 2 - Find the relative frequency for the frequency...Ch. 2 - Find the relative frequency for the frequency...Ch. 2 - Construct a histogram, frequency polygon, and...Ch. 2 - Construct a histogram, frequency polygon, and...Ch. 2 - Construct a histogram, frequency polygon, and...Ch. 2 - Construct a histogram, frequency polygon, and...Ch. 2 - Non-Alcoholic Beverages The data show the yearly...Ch. 2 - Calories of Nuts The data show the number of...Ch. 2 - Crime The data show the percentage of the types of...Ch. 2 - AID: 1825 | 31/5/2018 16. Pet Care The data (in...Ch. 2 - Broadway Stage Engagements The data show the...Ch. 2 - High School Dropout Rate The data show the high...Ch. 2 - Prob. 2.3.19RECh. 2 - Smart Phone Insurance Construct and analyze a pie...Ch. 2 - Prob. 2.3.21RECh. 2 - Prob. 2.3.22RECh. 2 - Weights of Football Players A local football team...Ch. 2 - Public Libraries The numbers of public libraries...Ch. 2 - Pain Relief The graph below shows the time it...Ch. 2 - Casino Payoffs The graph shows the payoffs...Ch. 2 - From the Data Bank located in Appendix B, choose...Ch. 2 - Prob. 2DACh. 2 - From the Data Bank, select at least 30 subjects...Ch. 2 - Prob. 4DACh. 2 - Using the data from Data Set XI in Appendix B,...Ch. 2 - Prob. 7DACh. 2 - Determine whether each statement is true or false....Ch. 2 - Prob. 2CQCh. 2 - Prob. 3CQCh. 2 - Frequency distributions can aid the researcher in...Ch. 2 - Determine whether each statement is true or false....Ch. 2 - Prob. 6CQCh. 2 - Determine whether each statement is true or false....Ch. 2 - Prob. 8CQCh. 2 - What are the boundaries for 8.68.8? a. 89 b....Ch. 2 - What graph should be used to show the relationship...Ch. 2 - Prob. 11CQCh. 2 - The three types of frequency distributions are...Ch. 2 - In a frequency distribution, the number of classes...Ch. 2 - Prob. 14CQCh. 2 - Data collected over a period of time can be...Ch. 2 - A statistical device used in exploratory data...Ch. 2 - On a Pareto chart, the frequencies should be...Ch. 2 - Housing Arrangements A questionnaire on housing...Ch. 2 - Housing Arrangements A questionnaire on housing...Ch. 2 - Prob. 20CQCh. 2 - Construct a histogram, a frequency polygon, and an...Ch. 2 - Coal Consumption The following data represent the...Ch. 2 - Construct a histogram, frequency polygon, and...Ch. 2 - Recycled Trash Construct a Pareto chart and a...Ch. 2 - Identity Thefts The results of a survey of 84...Ch. 2 - Needless Deaths of Children The New England...Ch. 2 - Prob. 27CQCh. 2 - Parking Meter Revenue In a small city the number...Ch. 2 - Prob. 29CQCh. 2 - The Great Lakes Shown are various statistics about...Ch. 2 - Teacher Strikes In Pennsylvania there were more...
Knowledge Booster


Learn more about
Need a deep-dive on the concept behind this application? Look no further. Learn more about this topic, statistics and related others by exploring similar questions and additional content below.Similar questions
- Percent 13 A car dealer specializing in minivan sales saibe conducts a survey to find out more about who its customers are. One of the variables at the company measures is gender; the results of this part of the survey are shown in the following bar graph. pow a. Interpret these results. b. Explain whether you think the bar graph is a fair and accurate representation of this data. 70 Gender of Customers 60 50 40 30 20 10 0 Males Femalesarrow_forwardThree cat- ency bar 10 Suppose that a health club asks 30 customers ad to rate the services as very good (1), good (2), fair (3), or poor (4). You can see the results in the following bar graph. What percentage of the customers rated the services as good? n; 2: pinion). of this to make a eople in ng ban?) Health Club Customer Ratings (1-very good,..., 4-poor) Frequency 10 8 00 6 11 A polling orga what voters t random samp for their opin no opinion. following ba a. Make a (includ bob. Evalua fairly tral 2 0 1 -2 3 4 540 480 420 360 300 240 Frequencyarrow_forward1 - Multiple Regression Equations and Predictions with XLMiner Analysis ToolPak (Structured) Video The owner of Showtime Movie Theaters, Inc., would like to predict weekly gross revenue as a function of advertising expenditures. Historical data for a sample of eight weeks are entered into the Microsoft Excel Online file below. Use the XLMiner Analysis ToolPak to perform your regression analysis in the designated areas of the spreadsheet. Due to a recent change by Microsoft you will need to open the XLMiner Analysis ToolPak add-in manually from the home ribbon. Screenshot of ToolPak X Open spreadsheet a. Develop an estimated regression equation with the amount of television advertising as the independent variable (to 2 decimals). JAN 27 Revenue = × TVAdv + b. Develop an estimated regression equation with both television advertising and newspaper advertising as the independent variables (to 2 decimals). Revenue = + TVAdy + NewsAdv c. Is the estimated regression equation coefficient for…arrow_forward
- Question 2: When John started his first job, his first end-of-year salary was $82,500. In the following years, he received salary raises as shown in the following table. Fill the Table: Fill the following table showing his end-of-year salary for each year. I have already provided the end-of-year salaries for the first three years. Calculate the end-of-year salaries for the remaining years using Excel. (If you Excel answer for the top 3 cells is not the same as the one in the following table, your formula / approach is incorrect) (2 points) Geometric Mean of Salary Raises: Calculate the geometric mean of the salary raises using the percentage figures provided in the second column named “% Raise”. (The geometric mean for this calculation should be nearly identical to the arithmetic mean. If your answer deviates significantly from the mean, it's likely incorrect. 2 points) Hint for the first part of question 2: To assist you with filling out the table in the first part of the question,…arrow_forwardConsider a sample with data values of 27, 25, 20, 15, 30, 34, 28, and 25. Compute the range, interquartile range, variance, and standard deviation (to a maximum of 2 decimals, if decimals are necessary). Range Interquartile range Variance Standard deviationarrow_forwardPerform a Step by step following tests in Microsoft Excel. Each of the following is 0.5 points, with a total of 6 points. Provide your answers in the following table. Median Standard Deviation Minimum Maximum Range 1st Quartile 2nd Quartile 3rd Quartile Skewness; provide a one sentence explanation of what does the skewness value indicates Kurtosis; provide a one sentence explanation of what does the kurtosis value indicates Make a labelled histogram; no point awarded if it is not labelled Make a labelled boxplot; no point awarded if it is not labelled Data 27 30 22 25 24 22 20 28 20 26 21 23 24 20 28 30 20 28 29 30 21 26 29 25 26 25 20 30 26 28 25 21 22 27 27 24 26 22 29 28 30 22 22 22 30 21 21 30 26 20arrow_forward
- Obtain the linear equation for trend for time series with St² = 140, Ey = 16.91 and Σty= 62.02, m n = 7arrow_forwardA quality characteristic of a product is normally distributed with mean μ and standard deviation σ = 1. Speci- fications on the characteristic are 6≤x≤8. A unit that falls within specifications on this quality characteristic results in a profit of Co. However, if x 8, the profit is -C2. Find the value ofμ that maximizes the expected profit.arrow_forwardA) The output voltage of a power supply is normally distributed with mean 5 V and standard deviation 0.02 V. If the lower and upper specifications for voltage are 4.95 V and 5.05 V, respectively, what is the probability that a power supply selected at random conform to the specifications on voltage? B) Continuation of A. Reconsider the power supply manufacturing process in A. Suppose We wanted to improve the process. Can shifting the mean reduce the number of nonconforming units produced? How much would the process variability need to be reduced in order to have all but one out of 1000 units conform to the specifications?arrow_forward
- der to complete the Case X T Civil Service Numerical Test Sec X T Casework Skills Practice Test Maseline Vaseline x + euauthoring.panpowered.com/DeliveryWeb/Civil Service Main/84589a48-6934-4b6e-a6e1-a5d75f559df9?transferToken-News NGSSON The table below shows the best price available for various items from 4 uniform suppliers. The prices do not include VAT (charged at 20%). Item Waterproof boots A1-Uniforms (£)Best Trade (£)Clothing Tech (£)Dress Right (£) 59.99 39.99 59.99 49.99 Trousers 9.89 9.98 9.99 11.99 Shirts 14.99 15.99 16.99 12.99 Hi-Vis vest 4.49 4.50 4.00 4.00 20.00 25.00 19.50 19.99 Hard hats A company needs to buy a set of 12 uniforms which includes 1 of each item. If the special offers are included which supplier is cheapest? OOO A1-Uniforms Best Trade Clothing Tech Q Search + ** 109 8 CO* F10 Home F11 F12 6arrow_forwardto complete the Case × T Civil Service Numerical Test Sec x T Casework Skills Practice Test + Vaseline euauthoring.panpowered.com/DeliveryWeb/Civil Service Main/84589a48-b934-4b6e-a6e1-a5d75f559df9?transferToken=MxNewOS NGFSPSZSMOMzuz The table below shows the best price available for various items from 4 uniform suppliers. The prices do not include VAT (charged at 20%). Item A1-Uniforms (£)Best Trade (£)Clothing Tech (£)Dress Right (£) Waterproof boots 59.99 39.99 59.99 49.99 Trousers 9.89 9.98 9.99 11.99 Shirts 14.99 15.99 16.99 12.99 Hi-Vis vest 4.49 4.50 4.00 4.00 20.00 25.00 19.50 19.99 Hard hats A company needs to buy a set of 12 uniforms which includes 1 of each item. If the special offers are included, which supplier is cheapest? O O O O A1-Uniforms Best Trade Clothing Tech Dress Right Q Search ENG L UK +0 F6 四吧 6 78 ㄓ F10 9% * CO 1 F12 34 Oarrow_forwardCritics review films out of 5 based on three attributes: the story, the special effects and the acting. The ratings of four critics for a film are collected in the table below.CriticSpecialStory rating Effects rating Acting rating Critic 14.44.34.5Critic 24.14.23.9Critic 33.943.4Critic 44.24.14.2Critic 1 also gave the film a rating for the Director's ability. If the average of Critic 1's ratings was 4.3 what rating did they give to the Director's ability?3.94.04.14.24.3arrow_forward
arrow_back_ios
SEE MORE QUESTIONS
arrow_forward_ios
Recommended textbooks for you
 Glencoe Algebra 1, Student Edition, 9780079039897...AlgebraISBN:9780079039897Author:CarterPublisher:McGraw Hill
 Big Ideas Math A Bridge To Success Algebra 1: Stu...AlgebraISBN:9781680331141Author:HOUGHTON MIFFLIN HARCOURTPublisher:Houghton Mifflin Harcourt
 Algebra: Structure And Method, Book 1AlgebraISBN:9780395977224Author:Richard G. Brown, Mary P. Dolciani, Robert H. Sorgenfrey, William L. ColePublisher:McDougal Littell
 Holt Mcdougal Larson Pre-algebra: Student Edition...AlgebraISBN:9780547587776Author:HOLT MCDOUGALPublisher:HOLT MCDOUGAL
Glencoe Algebra 1, Student Edition, 9780079039897...
Algebra
ISBN:9780079039897
Author:Carter
Publisher:McGraw Hill
Big Ideas Math A Bridge To Success Algebra 1: Stu...
Algebra
ISBN:9781680331141
Author:HOUGHTON MIFFLIN HARCOURT
Publisher:Houghton Mifflin Harcourt
Algebra: Structure And Method, Book 1
Algebra
ISBN:9780395977224
Author:Richard G. Brown, Mary P. Dolciani, Robert H. Sorgenfrey, William L. Cole
Publisher:McDougal Littell
Holt Mcdougal Larson Pre-algebra: Student Edition...
Algebra
ISBN:9780547587776
Author:HOLT MCDOUGAL
Publisher:HOLT MCDOUGAL
Matrix Operations Full Length; Author: ProfRobBob;https://www.youtube.com/watch?v=K5BLNZw7UeU;License: Standard YouTube License, CC-BY
Intro to Matrices; Author: The Organic Chemistry Tutor;https://www.youtube.com/watch?v=yRwQ7A6jVLk;License: Standard YouTube License, CC-BY