Concept explainers
Videos
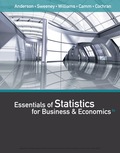
Pelican Stores, a division of National Clothing, is a chain of women’s apparel stores operating throughout the country. The chain recently ran a promotion in which discount coupons were sent to customers of other National Clothing stores. Data collected for a sample of 100 in-store credit card transactions at Pelican Stores during one day while the promotion was running are contained in the file named PelicanStores. Table 2.19 shows a portion of the data set. The Proprietary Card method of payment refers to charges made using a National Clothing charge card. Customers who made a purchase using a discount coupon are referred to as promotional customers and customers who made a purchase but did not use a discount coupon are referred to as regular customers. Because the promotional coupons were not sent to regular Pelican Stores customers, management considers the sales made to people presenting the promotional coupons as sales it would not otherwise make. Of course, Pelican also hopes that the promotional customers will continue to shop at its stores.
Most of the variables shown in Table 2.19 are self-explanatory, but two of the variables require some clarification.
Items The total number of items purchased
Net Sales The total amount ($) charged to the credit card
Pelican’s management would like to use this sample data to learn about its customer base and to evaluate the promotion involving discount coupons.
Managerial Report
Use the tabular and graphical methods of
- 1. Percent frequency distribution for key variables.
- 2. A bar chart or pie chart showing the number of customer purchases attributable to the method of payment.
- 3. A crosstabulation of type of customer (regular or promotional) versus net sales. Comment on any similarities or differences present.
- 4. A
scatter diagram to explore the relationship between net sales and customer age.
Want to see the full answer?
Check out a sample textbook solution
Chapter 2 Solutions
EBK ESSENTIALS OF STATISTICS FOR BUSINE


- A well-known company predominantly makes flat pack furniture for students. Variability with the automated machinery means the wood components are cut with a standard deviation in length of 0.45 mm. After they are cut the components are measured. If their length is more than 1.2 mm from the required length, the components are rejected. a) Calculate the percentage of components that get rejected. b) In a manufacturing run of 1000 units, how many are expected to be rejected? c) The company wishes to install more accurate equipment in order to reduce the rejection rate by one-half, using the same ±1.2mm rejection criterion. Calculate the maximum acceptable standard deviation of the new process.arrow_forward5. Let X and Y be independent random variables and let the superscripts denote symmetrization (recall Sect. 3.6). Show that (X + Y) X+ys.arrow_forward8. Suppose that the moments of the random variable X are constant, that is, suppose that EX" =c for all n ≥ 1, for some constant c. Find the distribution of X.arrow_forward
- 9. The concentration function of a random variable X is defined as Qx(h) = sup P(x ≤ X ≤x+h), h>0. Show that, if X and Y are independent random variables, then Qx+y (h) min{Qx(h). Qr (h)).arrow_forward10. Prove that, if (t)=1+0(12) as asf->> O is a characteristic function, then p = 1.arrow_forward9. The concentration function of a random variable X is defined as Qx(h) sup P(x ≤x≤x+h), h>0. (b) Is it true that Qx(ah) =aQx (h)?arrow_forward
- 3. Let X1, X2,..., X, be independent, Exp(1)-distributed random variables, and set V₁₁ = max Xk and W₁ = X₁+x+x+ Isk≤narrow_forward7. Consider the function (t)=(1+|t|)e, ER. (a) Prove that is a characteristic function. (b) Prove that the corresponding distribution is absolutely continuous. (c) Prove, departing from itself, that the distribution has finite mean and variance. (d) Prove, without computation, that the mean equals 0. (e) Compute the density.arrow_forward1. Show, by using characteristic, or moment generating functions, that if fx(x) = ½ex, -∞0 < x < ∞, then XY₁ - Y2, where Y₁ and Y2 are independent, exponentially distributed random variables.arrow_forward
- 1. Show, by using characteristic, or moment generating functions, that if 1 fx(x): x) = ½exarrow_forward1990) 02-02 50% mesob berceus +7 What's the probability of getting more than 1 head on 10 flips of a fair coin?arrow_forward9. The concentration function of a random variable X is defined as Qx(h) sup P(x≤x≤x+h), h>0. = x (a) Show that Qx+b(h) = Qx(h).arrow_forward
 Glencoe Algebra 1, Student Edition, 9780079039897...AlgebraISBN:9780079039897Author:CarterPublisher:McGraw Hill
 Holt Mcdougal Larson Pre-algebra: Student Edition...AlgebraISBN:9780547587776Author:HOLT MCDOUGALPublisher:HOLT MCDOUGAL
 Big Ideas Math A Bridge To Success Algebra 1: Stu...AlgebraISBN:9781680331141Author:HOUGHTON MIFFLIN HARCOURTPublisher:Houghton Mifflin Harcourt