
STAT TECH IN BUSINESS & ECON AC
18th Edition
ISBN: 9781264731657
Author: Lind
Publisher: MCG
expand_more
expand_more
format_list_bulleted
Videos
Textbook Question
Chapter 19, Problem 28CE
Steele Breakfast Foods Inc. produces a popular brand of raisin bran cereal. The package indicates it contains 25.0 ounces of cereal. To ensure the product quality, the Steele inspection department makes hourly checks on the production process. As a part of the hourly check, four boxes are selected and their contents weighed. The results for 25 samples are reported below.
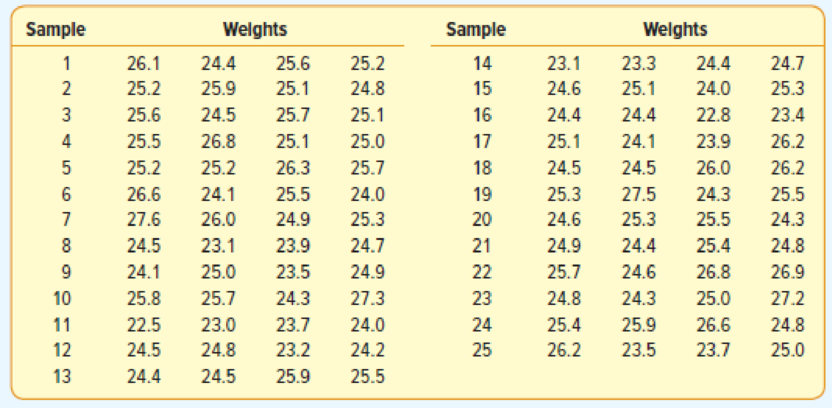
Develop an appropriate control chart. What are the limits? Is the process out of control at any time?
Expert Solution & Answer
Want to see the full answer?
Check out a sample textbook solution
Students have asked these similar questions
iid
1. The CLT provides an approximate sampling distribution for the arithmetic average Ỹ of a
random sample Y₁, . . ., Yn f(y). The parameters of the approximate sampling distribution
depend on the mean and variance of the underlying random variables (i.e., the population
mean and variance). The approximation can be written to emphasize this, using the expec-
tation and variance of one of the random variables in the sample instead of the parameters
μ, 02:
YNEY,
· (1
(EY,, varyi
n
For the following population distributions f, write the approximate distribution of the sample
mean.
(a) Exponential with rate ẞ: f(y) = ß exp{−ßy}
1
(b) Chi-square with degrees of freedom: f(y) = ( 4 ) 2 y = exp { — ½/ }
г(
(c) Poisson with rate λ: P(Y = y) = exp(-\}
>
y!
y²
2. Let Y₁,……., Y be a random sample with common mean μ and common variance σ². Use the
CLT to write an expression approximating the CDF P(Ỹ ≤ x) in terms of µ, σ² and n, and
the standard normal CDF Fz(·).
math
Chapter 19 Solutions
STAT TECH IN BUSINESS & ECON AC
Ch. 19 - The Rouse Home, located on the south side of...Ch. 19 - Tom Sharkey is the owner of Sharkey Chevy, Buick,...Ch. 19 - Out of 110 diesel engines tested, a rework and...Ch. 19 - The manager of River City McDonalds randomly...Ch. 19 - Describe the difference between assignable...Ch. 19 - Describe the difference between an attribute...Ch. 19 - Samples of size n = 4 are selected from a...Ch. 19 - Samples of size 5 are selected from a...Ch. 19 - A new industrial oven has just been installed at...Ch. 19 - Refer to Exercise 7. a. On the basis of this...
Ch. 19 - Auto-Lite Company manufactures car batteries. At...Ch. 19 - Below is a p-chart for a manufacturing process. a....Ch. 19 - Inter-State Moving and Storage Company is setting...Ch. 19 - A bicycle manufacturer randomly selects 10 frames...Ch. 19 - During the process of producing toilet paper,...Ch. 19 - Sams Supermarkets monitors the checkout scanners...Ch. 19 - Dave Christi runs a car wash chain with outlets...Ch. 19 - Compute the probability of accepting a lot of DVDs...Ch. 19 - Determine the probability of accepting lots that...Ch. 19 - Determine the probability of accepting lots that...Ch. 19 - Warren Electric manufactures fuses for many...Ch. 19 - Grills Video Products purchases LCDs from Mira...Ch. 19 - The production supervisor at Westburg Electric...Ch. 19 - The manufacturer of running shoes conducted a...Ch. 19 - At Rumseys Old Fashion Roast Beef, cola drinks are...Ch. 19 - A new machine has just been installed to produce...Ch. 19 - Long Last Tire Company, as part of its inspection...Ch. 19 - Charter National Bank has a staff of loan officers...Ch. 19 - Prob. 25CECh. 19 - Early Morning Delivery Service guarantees delivery...Ch. 19 - An automatic machine produces 5.0-millimeter bolts...Ch. 19 - Steele Breakfast Foods Inc. produces a popular...Ch. 19 - An investor believes there is a 5050 chance that a...Ch. 19 - Lahey Motors specializes in selling cars to buyers...Ch. 19 - A process engineer is considering two sampling...Ch. 19 - Christina Sanders is a member of the womens...Ch. 19 - Erics Cookie House sells chocolate chip cookies in...Ch. 19 - The numbers of near misses recorded for the last...Ch. 19 - Prob. 35CECh. 19 - Swiss Watches, Ltd. purchases watch stems for...Ch. 19 - Automatic Screen Door Manufacturing Company...Ch. 19 - Prob. 38CE
Knowledge Booster


Learn more about
Need a deep-dive on the concept behind this application? Look no further. Learn more about this topic, statistics and related others by exploring similar questions and additional content below.Similar questions
- Compute the median of the following data. 32, 41, 36, 42, 29, 30, 40, 22, 25, 37arrow_forwardTask Description: Read the following case study and answer the questions that follow. Ella is a 9-year-old third-grade student in an inclusive classroom. She has been diagnosed with Emotional and Behavioural Disorder (EBD). She has been struggling academically and socially due to challenges related to self-regulation, impulsivity, and emotional outbursts. Ella's behaviour includes frequent tantrums, defiance toward authority figures, and difficulty forming positive relationships with peers. Despite her challenges, Ella shows an interest in art and creative activities and demonstrates strong verbal skills when calm. Describe 2 strategies that could be implemented that could help Ella regulate her emotions in class (4 marks) Explain 2 strategies that could improve Ella’s social skills (4 marks) Identify 2 accommodations that could be implemented to support Ella academic progress and provide a rationale for your recommendation.(6 marks) Provide a detailed explanation of 2 ways…arrow_forwardQuestion 2: When John started his first job, his first end-of-year salary was $82,500. In the following years, he received salary raises as shown in the following table. Fill the Table: Fill the following table showing his end-of-year salary for each year. I have already provided the end-of-year salaries for the first three years. Calculate the end-of-year salaries for the remaining years using Excel. (If you Excel answer for the top 3 cells is not the same as the one in the following table, your formula / approach is incorrect) (2 points) Geometric Mean of Salary Raises: Calculate the geometric mean of the salary raises using the percentage figures provided in the second column named “% Raise”. (The geometric mean for this calculation should be nearly identical to the arithmetic mean. If your answer deviates significantly from the mean, it's likely incorrect. 2 points) Starting salary % Raise Raise Salary after raise 75000 10% 7500 82500 82500 4% 3300…arrow_forward
- I need help with this problem and an explanation of the solution for the image described below. (Statistics: Engineering Probabilities)arrow_forwardI need help with this problem and an explanation of the solution for the image described below. (Statistics: Engineering Probabilities)arrow_forward310015 K Question 9, 5.2.28-T Part 1 of 4 HW Score: 85.96%, 49 of 57 points Points: 1 Save of 6 Based on a poll, among adults who regret getting tattoos, 28% say that they were too young when they got their tattoos. Assume that six adults who regret getting tattoos are randomly selected, and find the indicated probability. Complete parts (a) through (d) below. a. Find the probability that none of the selected adults say that they were too young to get tattoos. 0.0520 (Round to four decimal places as needed.) Clear all Final check Feb 7 12:47 US Oarrow_forward
- how could the bar graph have been organized differently to make it easier to compare opinion changes within political partiesarrow_forwardDraw a picture of a normal distribution with mean 70 and standard deviation 5.arrow_forwardWhat do you guess are the standard deviations of the two distributions in the previous example problem?arrow_forward
- Please answer the questionsarrow_forward30. An individual who has automobile insurance from a certain company is randomly selected. Let Y be the num- ber of moving violations for which the individual was cited during the last 3 years. The pmf of Y isy | 1 2 4 8 16p(y) | .05 .10 .35 .40 .10 a.Compute E(Y).b. Suppose an individual with Y violations incurs a surcharge of $100Y^2. Calculate the expected amount of the surcharge.arrow_forward24. An insurance company offers its policyholders a num- ber of different premium payment options. For a ran- domly selected policyholder, let X = the number of months between successive payments. The cdf of X is as follows: F(x)=0.00 : x < 10.30 : 1≤x<30.40 : 3≤ x < 40.45 : 4≤ x <60.60 : 6≤ x < 121.00 : 12≤ x a. What is the pmf of X?b. Using just the cdf, compute P(3≤ X ≤6) and P(4≤ X).arrow_forward
arrow_back_ios
SEE MORE QUESTIONS
arrow_forward_ios
Recommended textbooks for you
 Big Ideas Math A Bridge To Success Algebra 1: Stu...AlgebraISBN:9781680331141Author:HOUGHTON MIFFLIN HARCOURTPublisher:Houghton Mifflin Harcourt
 Glencoe Algebra 1, Student Edition, 9780079039897...AlgebraISBN:9780079039897Author:CarterPublisher:McGraw Hill
 Holt Mcdougal Larson Pre-algebra: Student Edition...AlgebraISBN:9780547587776Author:HOLT MCDOUGALPublisher:HOLT MCDOUGAL
Big Ideas Math A Bridge To Success Algebra 1: Stu...
Algebra
ISBN:9781680331141
Author:HOUGHTON MIFFLIN HARCOURT
Publisher:Houghton Mifflin Harcourt
Glencoe Algebra 1, Student Edition, 9780079039897...
Algebra
ISBN:9780079039897
Author:Carter
Publisher:McGraw Hill
Holt Mcdougal Larson Pre-algebra: Student Edition...
Algebra
ISBN:9780547587776
Author:HOLT MCDOUGAL
Publisher:HOLT MCDOUGAL
Introduction to Statistical Quality Control (SQC); Author: FORSEdu;https://www.youtube.com/watch?v=c18FKHUDZv8;License: Standard YouTube License, CC-BY
[DAXX] Introduction to Statistical Quality Control; Author: The Academician;https://www.youtube.com/watch?v=ypZGDxjSM60;License: Standard Youtube License