Pearson eText Genetic Analysis: An Integrated Approach -- Instant Access (Pearson+)
3rd Edition
ISBN: 9780135564172
Author: Mark Sanders, John Bowman
Publisher: PEARSON+
expand_more
expand_more
format_list_bulleted
Concept explainers
Videos
Textbook Question
Chapter 19, Problem 14P
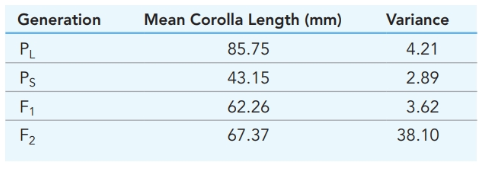
In Nicotiana, two inbred strains produce long(
Expert Solution & Answer
Want to see the full answer?
Check out a sample textbook solution
Students have asked these similar questions
The phenotypic data below are the shoot lengths of 25 F1 and 25 F2 rice plants atseedling stage, produced from the cross of IR29 and Hasawi rice varieties. The mean lengths of the shoot from IR29 and Hasawi are 23.1 cm and 46.7 cm, respectively. Tabulate and plot the frequency distributions of the F1 and F2 generations. From each distribution calculate the mean, the variance,and the standard error of the mean. What is the main difference between F1 and F2 distributions?
Formulas needed:Range (R) = maximum – minimum (Use the same no. of decimal places as original data.)No. of phenotypic classes (K) = 1 + 3.3logn (Round up answer to an integer. Number may still be increased or decreased as needed.)n = total no. of valuesClass interval (CI) = R/K (Use the same no. of decimal places as original data.)
A wide-ranging survey of Nicotonia growing in its natural environment recorded a variation in corolla length ranging from 12mm to 47mm with a variance of 36.5. Subsequently, collected seeds were grown in a greenhouse and it was found that the range was now very much lower with most plants having similar corolla lengths and the variance was now only 8.4.
ALL WORKING MUST BE SHOWN
a) What is the heritability of corolla length?
A wide-ranging survey of Nicotonia growing in its natural environment recorded a variation in corolla length ranging from 12mm to 47mm with a variance of 36.5. Subsequently, collected seeds were grown in a greenhouse and it was found that the range was now very much lower with most plants having similar corolla lengths and the variance was now only 8.4.
What is the heritability of corolla length?
Chapter 19 Solutions
Pearson eText Genetic Analysis: An Integrated Approach -- Instant Access (Pearson+)
Ch. 19 - Which of the following traits would you expect to...Ch. 19 - 19.2 For the traits listed in the previous...Ch. 19 - Compare and contrast broad sense heritability and...Ch. 19 - 19.4 In a cross of two pure-breeding lines of...Ch. 19 - 19.5 Describe the difference between continuous...Ch. 19 - Prob. 6PCh. 19 - 19.7 Provide a definition and an example for each...Ch. 19 - 19.8 What is a random sample, and why can a random...Ch. 19 - 19.9 Why is heritability an important phenomenon...Ch. 19 - 19.10 Three pairs of genes with two alleles each (...
Ch. 19 - 19.11 In selective breeding experiments, it is...Ch. 19 - 19.12 Two inbred lines of sunflowers produce...Ch. 19 - What is quantitative trait locus (QTL)? Suppose...Ch. 19 - 19.14 In Nicotiana, two inbred strains produce...Ch. 19 - 19.15 Suppose the length of maize ears has narrow...Ch. 19 - In a line of cherry tomatoes, the average fruit...Ch. 19 - 19.17 Two purebreeding wheat strains, one...Ch. 19 - Prob. 18PCh. 19 - During a visit with your grandparents, they...Ch. 19 - 19.20 An association of racehorse owners is...Ch. 19 - Prob. 21PCh. 19 - Suppose a polygenic system for producing color in...Ch. 19 - New Zealand lamb breeders measure the following...Ch. 19 - Cattle breeders would like to improve the protein...Ch. 19 - In human gestational development, abnormalities of...Ch. 19 - The children of couples in which one partner has...Ch. 19 - Answer the following in regard to multifactorial...Ch. 19 - 19.28 Suppose the mature height of a plant is a...Ch. 19 - A three-gene system of additive genes (A, B, and...Ch. 19 - 19.30 Congenital dislocation of the hip is a...Ch. 19 - A total of 20 men and 20 women volunteer to...
Knowledge Booster


Learn more about
Need a deep-dive on the concept behind this application? Look no further. Learn more about this topic, biology and related others by exploring similar questions and additional content below.Similar questions
- Corn plants from a test plot are measured, and the distribution of heights at 10-cm intervals is recorded in the following table: Height (cm) Plants (no.) 100 20 110 60 120 90 130 130 140 180 150 120 160 70 170 50 180 40 Calculate (a) the mean height, (b) the variance, (c) the standard deviation, and (d) the standard error of the mean. Plot a rough graph of plant height against frequency. Do the values represent a normal distribution? Based on your calculations, how would you assess the variation within this population?arrow_forwardThe mean, standard deviation, variances, and coefficient of variance of plant height from two rice plants (P1 and P2) and their progeny (F1 and F2) and a backcross generation (P1 x F1) are shown below. Explain the possible reasons for the observed differences in the sample means. Account for the differences in the sample means of P1 and P2. Similarly, account for the differences in the sample means of the F1 and F2. Compare the difference in the parental generations with that in the filial generations.arrow_forwardWhat is the heritability of corolla length?arrow_forward
- A large ear of corn has a total of 433 grains, including 271 purple & smooth, 73 purple & shrunken, 63yellow & smooth, & 26 yellow & shrunken. Conduct a X^2 analysis to determine if this ear of corn was produced by adihybrid cross (PpRr x PpRr) resulting in a phenotypic ratio of 9:3:3:1.arrow_forwardThe mean and standard deviation of plant height from two rice plants (P1 and P2) and their progeny (F1 and F2) and a backcross generation (P1 x F1) are shown below. Compare the sample variances of P1 and P2. Account for any differences. Similarly, compare the sample variances of the F1 and F2 generations, and account for any differences. Give the possible causes of variation in each generation.arrow_forwardThe mean and variance of plant height of two highly inbred strains (P1 and P2) and their progeny (F1 and F2) are shown here. Strain Mean (cm) Variance P1 34.2 4.2 P2 55.3 3.8 F1 44.2 5.6 F2 46.3 10.3 Calculate the broad-sense heritability (H2) of plant height in this species.arrow_forward
- Kernel color in wheat is controlled by 2 pairs of genes (AABB). Determine the color of each offspring with the following genotypes: (Note: 4 alleles – red; 3 – medium red; 2 – intermediate red; 1 – light red; 0 – white). CAPITAL letters only and with spaces when applicable. AABb - AaBb - AABB - aaBb - aabb -arrow_forwardPurple is dominant to white in flower color determination. The F2 generation is as follows: 3/4 purple: 1/4 white. What is the genotypic ratio in the F1 generation?arrow_forwardA wide-ranging survey of Nicotonia growing in its natural environment recorded a variation in corolla length ranging from 12mm to 47mm with a variance of 36.5. Subsequently, collected seeds were grown in a greenhouse and it was found that the range was now very much lower with most plants having similar corolla lengths and the variance was now only 8.4. After the plants had grown to maturity and formed seed, seeds were collected from plants with either the shortest and or the longest corollas in the population and planted separately in the greenhouse. When flowers were formed it was found that the variance of the plants with the shortest flowers was now 4.2 while that of the flowers from the longest seeds had become 13.7 Calculate the new values for heritability in the different groups of plants and explain why this difference may arise.arrow_forward
- please help with chartarrow_forwardCalculate the Variance of the following data set: 10, 15, 13, 12, 14arrow_forwardA cross was made between two pea plants, TtAa and Ttaa, whereT = tall, t = dwarf, A = axial, and a = terminal. What is the probability that the first three offspring will be tall with axial flowers or dwarf with terminal flowers and the fourth offspring will be tall with axial flowers? Discuss what operation(s) (e.g., product rule or binomial expansion equation) you used and in what order they were usedarrow_forward
arrow_back_ios
SEE MORE QUESTIONS
arrow_forward_ios
Recommended textbooks for you
 Human Anatomy & Physiology (11th Edition)BiologyISBN:9780134580999Author:Elaine N. Marieb, Katja N. HoehnPublisher:PEARSON
 Biology 2eBiologyISBN:9781947172517Author:Matthew Douglas, Jung Choi, Mary Ann ClarkPublisher:OpenStax
 Anatomy & PhysiologyBiologyISBN:9781259398629Author:McKinley, Michael P., O'loughlin, Valerie Dean, Bidle, Theresa StouterPublisher:Mcgraw Hill Education,
 Molecular Biology of the Cell (Sixth Edition)BiologyISBN:9780815344322Author:Bruce Alberts, Alexander D. Johnson, Julian Lewis, David Morgan, Martin Raff, Keith Roberts, Peter WalterPublisher:W. W. Norton & Company
 Laboratory Manual For Human Anatomy & PhysiologyBiologyISBN:9781260159363Author:Martin, Terry R., Prentice-craver, CynthiaPublisher:McGraw-Hill Publishing Co.
 Inquiry Into Life (16th Edition)BiologyISBN:9781260231700Author:Sylvia S. Mader, Michael WindelspechtPublisher:McGraw Hill Education
Human Anatomy & Physiology (11th Edition)
Biology
ISBN:9780134580999
Author:Elaine N. Marieb, Katja N. Hoehn
Publisher:PEARSON
Biology 2e
Biology
ISBN:9781947172517
Author:Matthew Douglas, Jung Choi, Mary Ann Clark
Publisher:OpenStax
Anatomy & Physiology
Biology
ISBN:9781259398629
Author:McKinley, Michael P., O'loughlin, Valerie Dean, Bidle, Theresa Stouter
Publisher:Mcgraw Hill Education,
Molecular Biology of the Cell (Sixth Edition)
Biology
ISBN:9780815344322
Author:Bruce Alberts, Alexander D. Johnson, Julian Lewis, David Morgan, Martin Raff, Keith Roberts, Peter Walter
Publisher:W. W. Norton & Company
Laboratory Manual For Human Anatomy & Physiology
Biology
ISBN:9781260159363
Author:Martin, Terry R., Prentice-craver, Cynthia
Publisher:McGraw-Hill Publishing Co.
Inquiry Into Life (16th Edition)
Biology
ISBN:9781260231700
Author:Sylvia S. Mader, Michael Windelspecht
Publisher:McGraw Hill Education
Mitochondrial mutations; Author: Useful Genetics;https://www.youtube.com/watch?v=GvgXe-3RJeU;License: CC-BY