Concept explainers
a)
1)
To determine: The system utilization rate.
Introduction: System utilization refers to percentage amount of capacity which is utilized or we can say that actual output is divided by potential output. It is operational metric for business which indicates aggregate productive capacity.
It reflects the ratio of demand to capacity or supply, it is also commonly known as Capacity utilization rate.
a)
1)
Answer to Problem 1P
Explanation of Solution
Given information:
Formula,
Where,
System utilization rate denoted by
Demand rate (measured as arrival) denoted by
Supply rate (measured as service) denoted by
Calculation of the system utilization:
Therefore, system utilization rate is 0.6000.
1)
To determine: The system utilization rate.
Introduction: System utilization refers to percentage amount of capacity which is utilized or we can say that actual output is divided by potential output. It is operational metric for business which indicates aggregate productive capacity.
It reflects the ratio of demand to capacity or supply, it is also commonly known as Capacity utilization rate.
1)
Answer to Problem 1P
Explanation of Solution
Given information:
Formula,
Where,
System utilization rate denoted by
Demand rate (measured as arrival) denoted by
Supply rate (measured as service) denoted by
Calculation of the system utilization:
Therefore, system utilization rate is 0.6000.
2)
To determine: The average number customers waiting for service in line.
2)
Answer to Problem 1P
Explanation of Solution
Explanation
Given information:
Formula as per single server model of average number customers waiting for service in line
Where,
Demand rate (measured as arrival) denoted by
Supply rate per server denoted by
Calculation of Average number of customers waiting in line (Lq):
Therefore, average number of customers waiting in line (Lq) is 0.9000.
3)
To determine: Average number of customers waiting time.
3)
Answer to Problem 1P
Explanation of Solution
Given information:
Formula as per single server model of average number customers waiting for service in line:
Where,
Demand rate (measured as arrival) denoted by
Calculation of Average number of customers waiting in line (
Therefore, average number customers waiting time (
b)
1)
To determine: The average number of customer waiting for repairs.
b)
1)
Answer to Problem 1P
Explanation of Solution
Given information:
Mean service time: 2 hours
M =1
Calculation of
Formula as per single server model of average number customers waiting for service in line:
Where,
Demand rate (measured as arrival) denoted by
Supply rate per server denoted by
Calculation of Average number of customers waiting in line (Lq):
Therefore, Average number of customers waiting in line (Lq) is 2.250.
1)
To determine: The average number of customer waiting for repairs.
1)
Answer to Problem 1P
Explanation of Solution
Given information:
Mean service time: 2 hours
M =1
Calculation of
Formula as per single server model of average number customers waiting for service in line:
Where,
Demand rate (measured as arrival) denoted by
Supply rate per server denoted by
Calculation of Average number of customers waiting in line (Lq):
Therefore, Average number of customers waiting in line (Lq) is 2.250.
2)
To determine: The system utilization rate.
Introduction: It reflects the ratio of demand to capacity or supply, it is also commonly known as Capacity utilization rate.
2)
Answer to Problem 1P
Explanation of Solution
Given information:
Formula,
Where,
System utilization rate denoted by
Demand rate (measured as arrival) denoted by
Supply rate (measured as service) denoted by
Calculation of the system utilization:
Therefore, system utilization rate is 0.750.
3)
To determine: The idle time.
3)
Answer to Problem 1P
Explanation of Solution
Calculation of the idle time:
Therefore, idle time per day per hours is 2hours per day.
4)
To determine: Probability of two or more customers in the system.
4)
Answer to Problem 1P
Explanation of Solution
Step 1: Calculate the probability of less than two:
Therefore, probability of less than two is 0.4375.
Step 2: Calculation probability of two or more than customer in the system:
Therefore, probability of less than two is 0.5625.
c)
1)
To determine: The system utilization rate.
c)
1)
Answer to Problem 1P
Explanation of Solution
Given information
Formula:
Where,
System utilization rate denoted by
Demand rate (measured as arrival) denoted by
Supply rate (measured as service) denoted by
Calculation of the system utilization:
Therefore, system utilization rate is 0.7500.
1)
To determine: The system utilization rate.
1)
Answer to Problem 1P
Explanation of Solution
Given information
Formula:
Where,
System utilization rate denoted by
Demand rate (measured as arrival) denoted by
Supply rate (measured as service) denoted by
Calculation of the system utilization:
Therefore, system utilization rate is 0.7500.
2)
To determine: Average number of customers in the system (Ls).
2)
Answer to Problem 1P
Explanation of Solution
Step 1: Calculation of the average number of customer served
Therefore average number of customer served is 1.5.
Step 2: find the value of
Given information:
Then, from Infinite-source values table we find that value for
For reference:
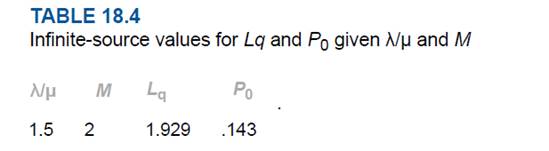
Step 3: Calculation of the average number of customers in the system (Ls)
Therefore, the average number of customers in the system (Ls) is 3.429.
3)
To determine: Average time customers wait in line for service (Wq).
3)
Answer to Problem 1P
Explanation of Solution
Therefore, the average time customers wait in line for service (Wq).is 0.107.
4)
To determine: The average waiting time for an arrival not immediately served (hours) (Wa).
4)
Answer to Problem 1P
Explanation of Solution
Calculation of average waiting time for an arrival not immediately served (hours) (Wa):
Therefore, average waiting time for an arrival not immediately served (hours) (Wa) is 0.167 hours.
Want to see more full solutions like this?
Chapter 18 Solutions
Operations Management (Comp. Instructor's Edition)


- Gas sales across type: 80% of gas sales tend to be regular. 15% midgrade, 5% tend to be premium. $0.10 increase in price per gallon tends to decrease gallons sold by 1 to 3%. Jan-0.87, Feb-0.95, Mar-1.00, Apr-1.05, May-1.08, Jun1.15, Jul-1.13, Aug-1.07, Sep-1.02, Oct-0.94, Nov-0.89, Dec-0.85. You want the MAPE to be below 20%, if ypu can get it to or below 10% they'll throw in extra $10k. Wont get bonus if it is above 11% or 20%. It cannot be over 20%.arrow_forwardhelp me choose the correct path please. There are other optionsarrow_forwardNegotiators can gain several benefits from using the strategy of multiple equivalent simultaneous offers. By offering multiple options it reduces the chance of rejection. It also improves the chances of reaching reaching an agreement. By presenting multiple offers, it shows you are flexible. agree with the postarrow_forward
- Negotiators can gain several benefits from using the strategy of multiple equivalent simultaneous offers. By offering multiple options it reduces the chance of rejection. It also improves the chances of reaching reaching an agreement. By presenting multiple offers, it shows you are flexible. disagree with this post or add on to the postarrow_forwardThe strategy of Multiple Equivalent Simultaneous Offers involves presenting several equally valuable options to the other party during negotiations. This approach benefits negotiators by creating flexibility and increasing the chances of finding a mutually agreeable solution. By offering multiple options, negotiators show that they are open to compromise, which can build trust and make the negotiation process smoother. It also helps avoid getting stuck on one issue, as the other party can choose from several alternatives that meet their needs. In my experience, using MESOs in a work negotiation helped both parties reach an agreement more quickly because each option was carefully thought out to address different needs, and this made it easier for us to settle on one that worked for both sides. This strategy can also reveal what is most important to the other party, helping negotiators understand their priorities better. agree or disagree with the postarrow_forwardExamine the conflicts between improving customer service levels and controlling costs in sales. Strategies to Balance Both customer service levels and controlling costs in sales 1.Outsourcing and workforce optimization 2. AI-driven customer supportarrow_forward
- how can you gain trust in a negotiation setting?arrow_forward✓ Custom $€ .0 .on File Home Insert Share Page Layout Formulas Data Review View Help Draw Arial 10 B B14 ✓ X✓ fx 1400 > 甘く 曲 > 冠 > Comments Editing ✓ . . . P Q R S T 3 A Production cost ($/unit) B с D E F G H J K L M N $74.00 4 Inventory holding cost ($/unit) $1.50 5 Lost sales cost ($/unit) $82.00 6 Overtime cost ($/unit) $6.80 7 Undertime cost ($/unit) $3.20 8 Rate change cost ($/unit) $5.00 9 Normal production rate (units) 2,000 10 Ending inventory (previous Dec.) 800 11 Cumulative 12 13 Month Demand Cumulative Demand Product Production Availability Ending Inventory Lost Cumulative Cumulative Product Sales 14 January 1,400 1,475 15 FUERANZ222222223323333BRUINE 14 February 1,000 2,275 Month January February Demand Demand Production Availability Ending Inventory Lost Sales 1,400 #N/A 1,475 #N/A #N/A #N/A 1,000 #N/A 2,275 #N/A #N/A #N/A 16 March 1,800 2,275 March 1,800 #N/A 2,275 #N/A #N/A #N/A 17 April 2,700 2,275 April 2,700 #N/A 2,275 #N/A #N/A #N/A 18 May 3,000 2,275 May 3,000 #N/A…arrow_forwardFollow guidelines and summarize in a paragrapharrow_forward
 Practical Management ScienceOperations ManagementISBN:9781337406659Author:WINSTON, Wayne L.Publisher:Cengage,
 MarketingMarketingISBN:9780357033791Author:Pride, William MPublisher:South Western Educational Publishing