Concept explainers
Videos
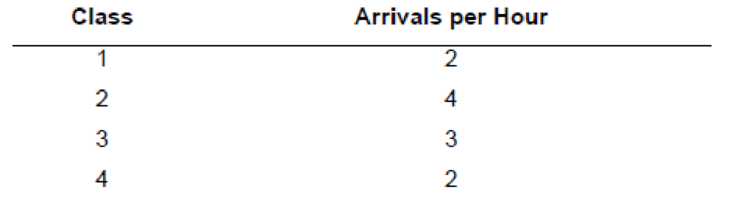
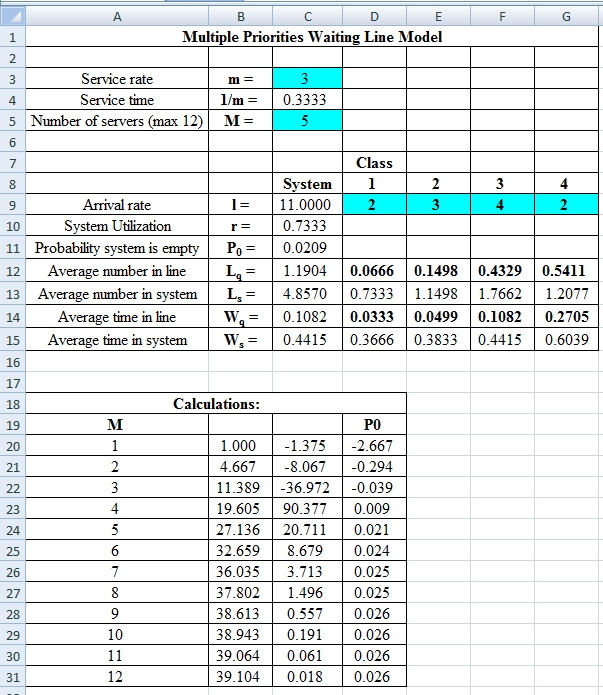
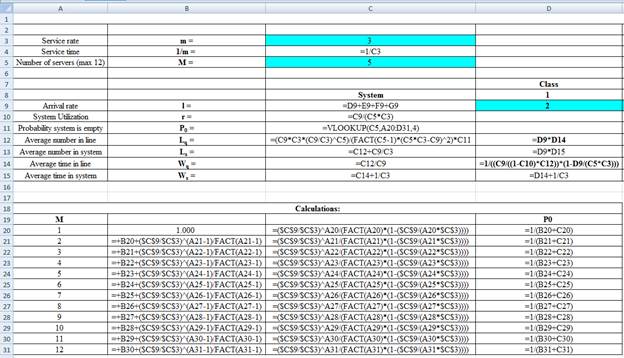
A priority waiting system assigns arriving customers to one of four classes. Arrival rates (Poisson) of the classes are shown in the following table. Five servers process the customers, and each can handle three customers per hour.
a. What is the system utilization?
b. What is the average wait for service by customers in the various classes? How many are waiting in each class, on average?
c. If the arrival rate of the second priority class could be reduced to three units per hour by shifting some arrivals into the third priority class, how would your answers to part b change?
d. What observations can you make based on your answers to part c?
a)
To determine: System utilization rate.
Introduction: Poisson distribution is utilized to ascertain the probability of an occasion happening over a specific time period or interval. The interval can be one of time, zone, volume or separation. The probability of an event happening is discovered utilizing the equation in the Poisson distribution.
Answer to Problem 16P
Explanation of Solution
Given Information:
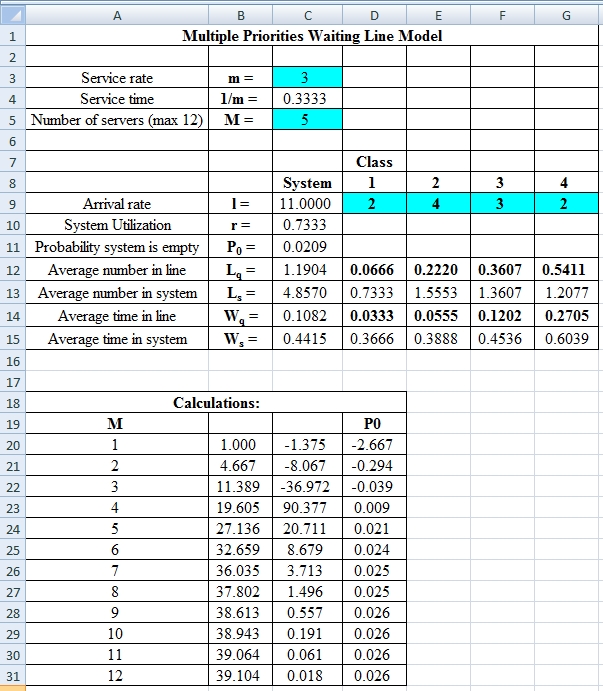
It is given that the processing time is 3 customers per hour and there are 5 servers to process the customers.
| Class | Arrivals per Hour |
| 1 | 2 |
| 2 | 4 |
| 3 | 3 |
| 4 | 2 |
Calculate the system utilization:
It is calculated by adding all the total customer hours for each class and the result is divided with number of servers and customer process per hour.
Here,
M = number of servers
Hence the system utilization is 0.7333.
b)
To determine: The average customer waiting for service for each class and waiting in each class on average.
Answer to Problem 16P
Explanation of Solution
Given Information:
It is given that the processing time is 3 customers per hour and there are 5 servers to process the customers.
| Class | Arrivals per Hour |
| 1 | 2 |
| 2 | 4 |
| 3 | 3 |
| 4 | 2 |
Calculate the average number of customers:
It is calculated by dividing the total customers arrive per hour with customer process per hour.
Here,
r = average number of customers
Calculate average number of customers waiting for service (Lq) using infinite-source table values for
The Lq values for
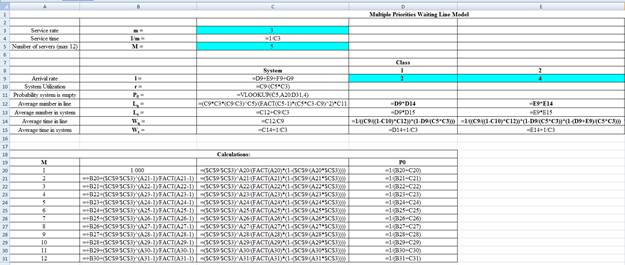
Calculate A using Formula 18-16 from book:
It is calculated by subtracting 1 minus system utilization rate and multiplying the result with Lq, the whole result is divided by total customer arrival rate.
Here,
Lq = average number of customers waiting for service
Calculate B using Formula 18-17 from book for each category
It is calculated by multiplying number of servers with customer service process rate per hour and the result is divided by total customer arrival rate for each category.
Here,
M = number of servers
Calculate the average waiting time for class 1 and class 2
It is calculated by multiplying A with B0 and B1, the result is divided by 1.
Calculate the average number of customers that are waiting for service for class 1 and class 2:
It is calculated by multiplying total customer arrival rate with average waiting time for units in each category.
Excel Spreadsheet:
Excel Workings:
Hence the average wait time for service by customers for class 1 is 0.0333 hours, class 2 is 0.0555 hours, class 3 is 0.1202 hours and class 4 is 0.2705 hours. The waiting in each class on average for class 1 is 0.0666 customers, class 2 is 0.2220 customers, class 3 is 0.3607 customers and class 4 is 0.5411 customers.
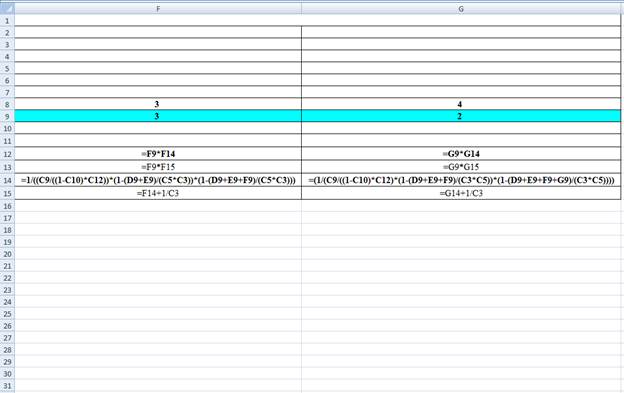
c)
To determine: The average customer waiting for service for each class and waiting in each class on average.
Answer to Problem 16P
Explanation of Solution
Given Information:
It is given that the processing time is 3 customers per hour and there are 5 servers to process the customers. The second priority class is reduced to 3 units per hour by shifting some into the third party class. The arrival rate is as follows,
| Class | Arrivals per Hour |
| 1 | 2 |
| 2 | 3 |
| 3 | 4 |
| 4 | 2 |
Calculate the average number of customers
It is calculated by dividing the total customers arrive per hour with customer process per hour.
Here,
r = average number of customers
Calculate average number of customers waiting for service (Lq) using infinite-source table values for
The Lq values for
Calculate A using Formula 18-16 from book:
It is calculated by subtracting 1 minus system utilization rate and multiplying the result with Lq, the whole result is divided by total customer arrival rate.
Here,
Lq = average number of customers waiting for service
Calculate B using Formula 18-17 from book for each category
It is calculated by multiplying number of servers with customer service process rate per hour and the result is divided by total customer arrival rate for each category.
Here,
M = number of servers
Calculate the average waiting time for class 1 and class 2
It is calculated by multiplying A with B0 and B1, the result is divided by 1.
Calculate the average number of customers that are waiting for service for class 1 and class 2:
It is calculated by multiplying total customer arrival rate with average waiting time for units in each category.
Excel Spreadsheet:
Excel Workings:
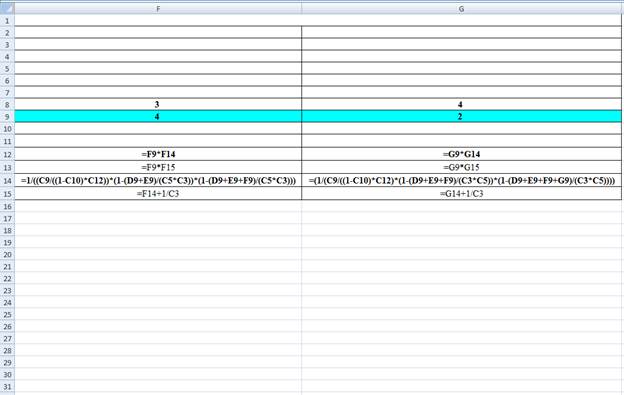
Hence the average wait time for service by customers for class 1 is 0.0333 hours, class 2 is 0.0499 hours, class 3 is 0.1082 hours and class 4 is 0.2705 hours. The waiting in each class on average for class 1 is 0.0666 customers, class 2 is 0.1498 customers, class 3 is 0.4329 customers and class 4 is 0.5411 customers.
d)
To determine: The observations based on the results from part c.
Answer to Problem 16P
Explanation of Solution
Calculate the change in average wait time for each class.
It is calculated by subtracting the final answer for average wait time for service by customers from part b with the final answer for average wait time for service by customers from part c.
The above results suggest that there is a decrease in average wait time for class 2 and class 3. Class 1 and 4 remains constant.
Calculate the change in average number waiting for each class.
It is calculated by subtracting the final answer for waiting on average from part b with the final answer for waiting on average from part c.
The above results suggest that there is a decrease in average waiting for class 2 and an increase in class 3. Class 1 and 4 remains constant.
Want to see more full solutions like this?
Chapter 18 Solutions
Operations Management (McGraw-Hill Series in Operations and Decision Sciences)


- Define delegation. Discuss in detail the four reasons why managers do delegation? Also statethe four main types of delegation.arrow_forwardB) Going forward, is Lean/JIT worth the risks? Should it be embraced (why?), abandoned (if so, why & what are the costs), or modified (how?) Do you think Lean works or not? Please write a complete response (about 1-2 paragraphs each part). Each team member should discuss and contribute so that the group agrees on their joint response. Please help each other and build upon and/or challenge others' points (in a respectful way!)arrow_forwardDiscuss the principle reasons that employee benefits have risen over the past 20 years, along with how best an organization can provide employees with a fair wage yet also provide some level of employee benefit coverage.arrow_forward
- Please assist with the Case Study below as attached. Read the case study below and answer the questions that follow. The Importance of the Planning Phase to Project Success. Traditional wisdom is that planning and analysis are very important and the more there is in a project, the more successful the project will be. Time spent on these activities will reduce risk and increase project success. On the other hand, inadequate analysis and planning will lead to a failed project. If poor planning has led to failed projects, then perhaps billions of dollars have been lost. But how much is too much? “Light weight” project management techniques such as agile are gaining popularity. Part of their ethos is that less initial planning is better and an evolutionary process is more efficient. QUESTION 1 The article above states: “Traditional wisdom is that planning and analysis are very important and the more there is in a project, the more successful the project will be”. Describe FIVE (5) ways…arrow_forwardOn a daily basis, the van is dispatched from Maplewood Hospital to pickup blood and platelet donations made at its local donation centers. The distances in miles between all locations may be found in the table below. Click the icon to view mileage data for Vampire Van. a. The van travels from the Hospital (A) to (B) to (C) to (D) to (E) and then returns to the Hospital (A). What is the total number of miles that the van must travel using this route? Route ABCDEA requires a total distance of 20.4 miles. (Enter your response rounded to one decimal place.) b. Using Maplewood Hospital as the beginning location, create a route using the Nearest Neighbor heuristic. What is the total number of miles that the van must travel using this route? The new route is A A and requires a total distance of miles. (Enter your response rounded to one decimal place.) More Info Maplewood City Center Westbrook Hospital (A) Donation Site (B) Donation Site (C) Municipal Park Donation Site (D) Valley Hills…arrow_forwardView the video Noodles & Company (8.28minutes, Ctrl + Click on the link); what are your key takeaways (tie to one or more of the topics discussed in Chapters 7 & 7S – service process design, type of job design, methods analysis, work methods, job design, learning curve effect, etc.) after watching this video. https://media.gaspar.mheducation.com/GASPARPlayer/play.html?id=E5i8OKgpqhwywhgFmpp1bmM Note: As a rough guideline, please try to keep the written submission to one or two paragraphs. 2) Leland, the job analyst at Zevo Toys, wanted to perform a time study on the assembling of toys. He observed one of the workers, Magorium, for five hours. During that time, Magorium assembled 250 toys. Leland rated Magorium as performing at 110 percent. The allowance for rest, personal time, etc. at Zevo Toys is 12 percent. a) Compute the normal time for the job. b) Compute the standard time for the job. Note: You could work out the problem by hand or use excel; in chapter 7,…arrow_forward
- 1) Noodles & Company View the video Noodles & Company (8.28minutes, Ctrl + Click on the link); what are your key takeaways (tie to one or more of the topics discussed in Chapters 7 & 7S – service process design, type of job design, methods analysis, work methods, job design, learning curve effect, etc.) after watching this video. https://media.gaspar.mheducation.com/GASPARPlayer/play.html?id=E5i8OKgpqhwywhgFmpp1bmM Note: As a rough guideline, please try to keep the written submission to one or two paragraphs. 2) Leland, the job analyst at Zevo Toys, wanted to perform a time study on the assembling of toys. He observed one of the workers, Magorium, for five hours. During that time, Magorium assembled 250 toys. Leland rated Magorium as performing at 110 percent. The allowance for rest, personal time, etc. at Zevo Toys is 12 percent. a) Compute the normal time for the job. b) Compute the standard time for the job. Note: You could work out the problem by hand or use…arrow_forwardAn investigation of career development opportunities and job satisfaction atarrow_forwardThe Donald Fertilizer Company produces industrial chemical fertilizers. The projected manufacturing requirements (in gallons) for the next four quarters are 90,000, 90,000, 60,000, and 140,000 respectively. A level workforce is desired, relying only on anticipation inventory as a supply option. Stockouts and backorders are to be avoided, as are overtime and undertime. a. Determine the quarterly production rate required to meet total demand for the year, and minimize the anticipation inventory that would be left over at the end of the year. Beginning inventory is 0. The quarterly production rate is 95000 gallons. (Enter your response as an integer.) b. Specify the anticipation inventory that will be produced. (Enter your responses as an integers.) Quarter Anticipation inventory (gallons) 1 5000 2 10000 3 4 45000 c. Suppose that the requirements (in gallons) for the next four quarters are revised to 140,000, 60,000, 90,000, and 90,000 respectively. If total demand is the same, what level…arrow_forward
- Please help with the attached Capstone proposal Requirements:arrow_forwardLong term capacity plans and how to properly make decisions regarding long-term planning Long-term capacity plans cover periods longer periods of time. These plans are suitable for large businesses that want to scale their operations with a proven strategy for achieving production targets and meeting customer demands. Long-term capacity plans consider other factors apart from the productive requirements of the company. How important is it, in your mind, to properly make decisions regarding long-term capacity planning? How does this decision impact the present and future profitability of an organization? Be specific and give examples.arrow_forwardIn addition to the Amazon case study you provided, I'm curious if you've encountered other examples of companies successfully applying Little's Law to enhance their supply chain risk management practices. For instance, have you seen organizations use queuing theory to assess the potential ripple effects of disruptions, stress-test their contingency plans, or identify critical control points that require heightened monitoring and agility? Please provide a referencearrow_forward
 Practical Management ScienceOperations ManagementISBN:9781337406659Author:WINSTON, Wayne L.Publisher:Cengage,
 MarketingMarketingISBN:9780357033791Author:Pride, William MPublisher:South Western Educational Publishing