APPLIED STAT.IN BUS.+ECONOMICS
6th Edition
ISBN: 9781259957598
Author: DOANE
Publisher: RENT MCG
bartleby

Videos

Textbook Question
Book Icon
Chapter 17, Problem 59CE

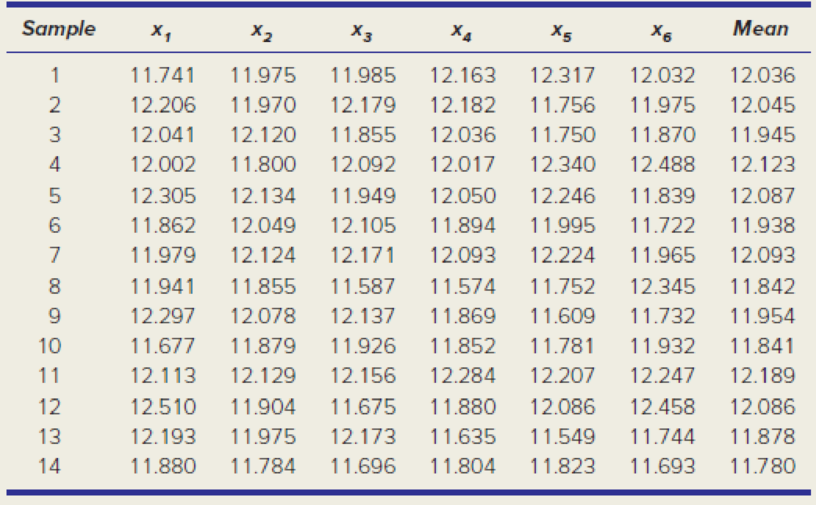
Each gum drop in two bags of Sathers Gum Drops was weighed (to the nearest .001 g) on a sensitive Mettler PE 360 Delta Range scale. After removing one outlier (to improve normality), there were 84 gum drops in the sample, yielding an overall mean x ¯ = 11.988 g and a pooled standard deviation s = .2208 g. (a) Use these sample statistics to construct control limits for an x ¯ chart, using a subgroup size n = 6. (b) Plot the means shown below on your control chart. Is the process in control? (c) Prepare a histogram and/or normal probability plot for the pooled sample. Does the sample support the view that gum drop weight is a normally distributed random variable? Explain.

Chapter 17, Problem 59CE, Each gum drop in two bags of Sathers Gum Drops was weighed (to the nearest .001 g) on a sensitive

Blurred answer
Students have asked these similar questions
NC Current Students - North Ce X | NC Canvas Login Links - North ( X Final Exam Comprehensive x Cengage Learning x WASTAT - Final Exam - STAT → C webassign.net/web/Student/Assignment-Responses/submit?dep=36055360&tags=autosave#question3659890_9 Part (b) Draw a scatter plot of the ordered pairs. N Life Expectancy Life Expectancy 80 70 600 50 40 30 20 10 Year of 1950 1970 1990 2010 Birth O Life Expectancy Part (c) 800 70 60 50 40 30 20 10 1950 1970 1990 W ALT 林 $ # 4 R J7 Year of 2010 Birth F6 4+ 80 70 60 50 40 30 20 10 Year of 1950 1970 1990 2010 Birth Life Expectancy Ox 800 70 60 50 40 30 20 10 Year of 1950 1970 1990 2010 Birth hp P.B. KA & 7 80 % 5 H A B F10 711 N M K 744 PRT SC ALT CTRL
Harvard University California Institute of Technology Massachusetts Institute of Technology Stanford University Princeton University University of Cambridge University of Oxford University of California, Berkeley Imperial College London Yale University University of California, Los Angeles University of Chicago Johns Hopkins University Cornell University ETH Zurich University of Michigan University of Toronto Columbia University University of Pennsylvania Carnegie Mellon University University of Hong Kong University College London University of Washington Duke University Northwestern University University of Tokyo Georgia Institute of Technology Pohang University of Science and Technology University of California, Santa Barbara University of British Columbia University of North Carolina at Chapel Hill University of California, San Diego University of Illinois at Urbana-Champaign National University of Singapore McGill…
Name Harvard University California Institute of Technology Massachusetts Institute of Technology Stanford University Princeton University University of Cambridge University of Oxford University of California, Berkeley Imperial College London Yale University University of California, Los Angeles University of Chicago Johns Hopkins University Cornell University ETH Zurich University of Michigan University of Toronto Columbia University University of Pennsylvania Carnegie Mellon University University of Hong Kong University College London University of Washington Duke University Northwestern University University of Tokyo Georgia Institute of Technology Pohang University of Science and Technology University of California, Santa Barbara University of British Columbia University of North Carolina at Chapel Hill University of California, San Diego University of Illinois at Urbana-Champaign National University of Singapore…

Chapter 17 Solutions

APPLIED STAT.IN BUS.+ECONOMICS

Ch. 17.3 - Why is the quality improvement process...Ch. 17.3 - Prob. 12SECh. 17.3 - Prob. 13SECh. 17.4 - Prob. 14SECh. 17.4 - Prob. 15SECh. 17.5 - (a) To construct control limits for an x chart,...Ch. 17.5 - Prob. 17SECh. 17.5 - List four rules for detecting abnormal (special...Ch. 17.5 - Set up control limits for an x chart, given x =...Ch. 17.5 - Prob. 20SECh. 17.5 - Prob. 21SECh. 17.5 - To print 8.5 5.5 note pads, a copy shop uses...Ch. 17.6 - Prob. 23SECh. 17.6 - Prob. 24SECh. 17.7 - Prob. 25SECh. 17.7 - Prob. 26SECh. 17.7 - Prob. 27SECh. 17.7 - Prob. 28SECh. 17.9 - Prob. 29SECh. 17.9 - Prob. 30SECh. 17.9 - Prob. 31SECh. 17 - Define (a) quality, (b) process, and (c)...Ch. 17 - Prob. 2CRCh. 17 - Prob. 3CRCh. 17 - Prob. 4CRCh. 17 - Prob. 5CRCh. 17 - Prob. 6CRCh. 17 - (a) Who was W. Edwards Deming and why is he...Ch. 17 - List three influential thinkers other than Deming...Ch. 17 - (a) Briefly explain each acronym: TQM, BPR, SQC,...Ch. 17 - (a) What is shown on the x chart? (b) Name three...Ch. 17 - Prob. 11CRCh. 17 - Prob. 12CRCh. 17 - Prob. 13CRCh. 17 - Prob. 14CRCh. 17 - Prob. 15CRCh. 17 - Briefly explain (a) the overadjustment problem,...Ch. 17 - Prob. 32CECh. 17 - Prob. 33CECh. 17 - Prob. 34CECh. 17 - Define three quality metrics that might be used to...Ch. 17 - Prob. 36CECh. 17 - Prob. 37CECh. 17 - Prob. 38CECh. 17 - Prob. 39CECh. 17 - Use your favorite Internet search engine to look...Ch. 17 - Make a fishbone chart (cause-and-effect diagram)...Ch. 17 - Make a fishbone chart (cause-and-effect diagram)...Ch. 17 - Make a fishbone chart (cause-and-effect diagram)...Ch. 17 - Prob. 44CECh. 17 - In painting an automobile, the thickness of the...Ch. 17 - Prob. 46CECh. 17 - Prob. 47CECh. 17 - Prob. 48CECh. 17 - In painting an automobile at the factory, the...Ch. 17 - Prob. 50CECh. 17 - Prob. 51CECh. 17 - Prob. 52CECh. 17 - Prob. 53CECh. 17 - A Nabisco Fig Newton has a process mean weight of...Ch. 17 - A new type of smoke detector battery is developed....Ch. 17 - Prob. 56CECh. 17 - Prob. 57CECh. 17 - Prob. 58CECh. 17 - Each gum drop in two bags of Sathers Gum Drops was...Ch. 17 - Prob. 60CECh. 17 - Prob. 61CECh. 17 - Prob. 62CECh. 17 - Prob. 63CECh. 17 - Refer to the bolt strength problem 17.47. Assuming...Ch. 17 - Refer to the paint problem 17.49 with =1.00 and ...
Knowledge Booster
Background pattern image
Statistics
Learn more about
Need a deep-dive on the concept behind this application? Look no further. Learn more about this topic, statistics and related others by exploring similar questions and additional content below.
Similar questions
SEE MORE QUESTIONS
Recommended textbooks for you
Text book image
Glencoe Algebra 1, Student Edition, 9780079039897...
Algebra
ISBN:9780079039897
Author:Carter
Publisher:McGraw Hill
Hypothesis Testing using Confidence Interval Approach; Author: BUM2413 Applied Statistics UMP;https://www.youtube.com/watch?v=Hq1l3e9pLyY;License: Standard YouTube License, CC-BY
Hypothesis Testing - Difference of Two Means - Student's -Distribution & Normal Distribution; Author: The Organic Chemistry Tutor;https://www.youtube.com/watch?v=UcZwyzwWU7o;License: Standard Youtube License