
APPLIED STAT.IN BUS.+ECONOMICS
6th Edition
ISBN: 9781259957598
Author: DOANE
Publisher: RENT MCG
expand_more
expand_more
format_list_bulleted
Videos
Textbook Question
Chapter 17, Problem 43CE
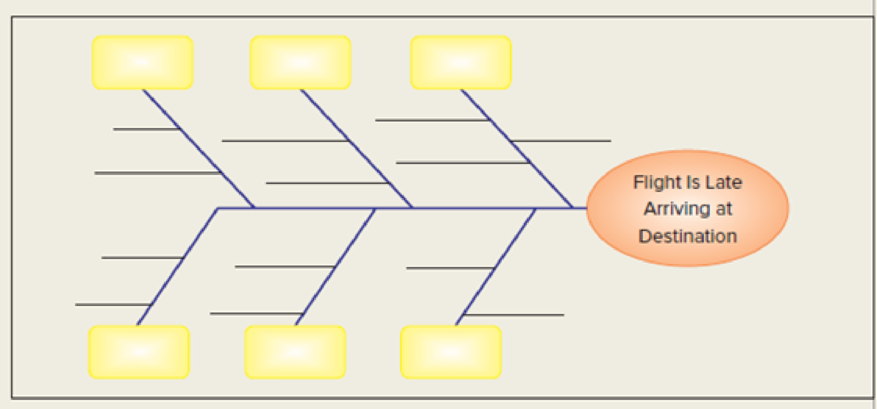
Make a fishbone chart (cause-and-effect diagram) for the reasons an airline flight might be late to arrive. Use as many branches as necessary. Which factors are most important? Which are most easily controlled?
Expert Solution & Answer
Want to see the full answer?
Check out a sample textbook solution
Students have asked these similar questions
https://www.hawkeslearning.com/Statistics/dbs2/datasets.html
NC Current Students - North Ce X | NC Canvas Login Links - North ( X
Final Exam Comprehensive x Cengage Learning
x
WASTAT - Final Exam - STAT
→
C
webassign.net/web/Student/Assignment-Responses/submit?dep=36055360&tags=autosave#question3659890_9
Part (b)
Draw a scatter plot of the ordered pairs.
N
Life
Expectancy
Life
Expectancy
80
70
600
50
40
30
20
10
Year of
1950
1970 1990
2010 Birth
O
Life
Expectancy
Part (c)
800
70
60
50
40
30
20
10
1950
1970 1990
W
ALT
林
$
#
4
R
J7
Year of
2010 Birth
F6
4+
80
70
60
50
40
30
20
10
Year of
1950 1970 1990
2010 Birth
Life
Expectancy
Ox
800
70
60
50
40
30
20
10
Year of
1950 1970 1990 2010 Birth
hp
P.B.
KA
&
7
80
% 5
H
A
B
F10
711
N
M
K
744
PRT SC
ALT
CTRL
Harvard University
California Institute of Technology
Massachusetts Institute of Technology
Stanford University
Princeton University
University of Cambridge
University of Oxford
University of California, Berkeley
Imperial College London
Yale University
University of California, Los Angeles
University of Chicago
Johns Hopkins University
Cornell University
ETH Zurich
University of Michigan
University of Toronto
Columbia University
University of Pennsylvania
Carnegie Mellon University
University of Hong Kong
University College London
University of Washington
Duke University
Northwestern University
University of Tokyo
Georgia Institute of Technology
Pohang University of Science and Technology
University of California, Santa Barbara
University of British Columbia
University of North Carolina at Chapel Hill
University of California, San Diego
University of Illinois at Urbana-Champaign
National University of Singapore
McGill…
Chapter 17 Solutions
APPLIED STAT.IN BUS.+ECONOMICS
Ch. 17.1 - Define (a) productivity, (b) quality control, and...Ch. 17.1 - Explain the relationship between productivity and...Ch. 17.1 - Explain the difference between common cause...Ch. 17.1 - Prob. 4SECh. 17.1 - Explain the role of statisticians in quality...Ch. 17.2 - Prob. 6SECh. 17.2 - Prob. 7SECh. 17.3 - Prob. 8SECh. 17.3 - Prob. 9SECh. 17.3 - Identify three common quality improvement programs...
Ch. 17.3 - Why is the quality improvement process...Ch. 17.3 - Prob. 12SECh. 17.3 - Prob. 13SECh. 17.4 - Prob. 14SECh. 17.4 - Prob. 15SECh. 17.5 - (a) To construct control limits for an x chart,...Ch. 17.5 - Prob. 17SECh. 17.5 - List four rules for detecting abnormal (special...Ch. 17.5 - Set up control limits for an x chart, given x =...Ch. 17.5 - Prob. 20SECh. 17.5 - Prob. 21SECh. 17.5 - To print 8.5 5.5 note pads, a copy shop uses...Ch. 17.6 - Prob. 23SECh. 17.6 - Prob. 24SECh. 17.7 - Prob. 25SECh. 17.7 - Prob. 26SECh. 17.7 - Prob. 27SECh. 17.7 - Prob. 28SECh. 17.9 - Prob. 29SECh. 17.9 - Prob. 30SECh. 17.9 - Prob. 31SECh. 17 - Define (a) quality, (b) process, and (c)...Ch. 17 - Prob. 2CRCh. 17 - Prob. 3CRCh. 17 - Prob. 4CRCh. 17 - Prob. 5CRCh. 17 - Prob. 6CRCh. 17 - (a) Who was W. Edwards Deming and why is he...Ch. 17 - List three influential thinkers other than Deming...Ch. 17 - (a) Briefly explain each acronym: TQM, BPR, SQC,...Ch. 17 - (a) What is shown on the x chart? (b) Name three...Ch. 17 - Prob. 11CRCh. 17 - Prob. 12CRCh. 17 - Prob. 13CRCh. 17 - Prob. 14CRCh. 17 - Prob. 15CRCh. 17 - Briefly explain (a) the overadjustment problem,...Ch. 17 - Prob. 32CECh. 17 - Prob. 33CECh. 17 - Prob. 34CECh. 17 - Define three quality metrics that might be used to...Ch. 17 - Prob. 36CECh. 17 - Prob. 37CECh. 17 - Prob. 38CECh. 17 - Prob. 39CECh. 17 - Use your favorite Internet search engine to look...Ch. 17 - Make a fishbone chart (cause-and-effect diagram)...Ch. 17 - Make a fishbone chart (cause-and-effect diagram)...Ch. 17 - Make a fishbone chart (cause-and-effect diagram)...Ch. 17 - Prob. 44CECh. 17 - In painting an automobile, the thickness of the...Ch. 17 - Prob. 46CECh. 17 - Prob. 47CECh. 17 - Prob. 48CECh. 17 - In painting an automobile at the factory, the...Ch. 17 - Prob. 50CECh. 17 - Prob. 51CECh. 17 - Prob. 52CECh. 17 - Prob. 53CECh. 17 - A Nabisco Fig Newton has a process mean weight of...Ch. 17 - A new type of smoke detector battery is developed....Ch. 17 - Prob. 56CECh. 17 - Prob. 57CECh. 17 - Prob. 58CECh. 17 - Each gum drop in two bags of Sathers Gum Drops was...Ch. 17 - Prob. 60CECh. 17 - Prob. 61CECh. 17 - Prob. 62CECh. 17 - Prob. 63CECh. 17 - Refer to the bolt strength problem 17.47. Assuming...Ch. 17 - Refer to the paint problem 17.49 with =1.00 and ...
Knowledge Booster


Learn more about
Need a deep-dive on the concept behind this application? Look no further. Learn more about this topic, statistics and related others by exploring similar questions and additional content below.Similar questions
- Name Harvard University California Institute of Technology Massachusetts Institute of Technology Stanford University Princeton University University of Cambridge University of Oxford University of California, Berkeley Imperial College London Yale University University of California, Los Angeles University of Chicago Johns Hopkins University Cornell University ETH Zurich University of Michigan University of Toronto Columbia University University of Pennsylvania Carnegie Mellon University University of Hong Kong University College London University of Washington Duke University Northwestern University University of Tokyo Georgia Institute of Technology Pohang University of Science and Technology University of California, Santa Barbara University of British Columbia University of North Carolina at Chapel Hill University of California, San Diego University of Illinois at Urbana-Champaign National University of Singapore…arrow_forwardA company found that the daily sales revenue of its flagship product follows a normal distribution with a mean of $4500 and a standard deviation of $450. The company defines a "high-sales day" that is, any day with sales exceeding $4800. please provide a step by step on how to get the answers in excel Q: What percentage of days can the company expect to have "high-sales days" or sales greater than $4800? Q: What is the sales revenue threshold for the bottom 10% of days? (please note that 10% refers to the probability/area under bell curve towards the lower tail of bell curve) Provide answers in the yellow cellsarrow_forwardFind the critical value for a left-tailed test using the F distribution with a 0.025, degrees of freedom in the numerator=12, and degrees of freedom in the denominator = 50. A portion of the table of critical values of the F-distribution is provided. Click the icon to view the partial table of critical values of the F-distribution. What is the critical value? (Round to two decimal places as needed.)arrow_forward
- A retail store manager claims that the average daily sales of the store are $1,500. You aim to test whether the actual average daily sales differ significantly from this claimed value. You can provide your answer by inserting a text box and the answer must include: Null hypothesis, Alternative hypothesis, Show answer (output table/summary table), and Conclusion based on the P value. Showing the calculation is a must. If calculation is missing,so please provide a step by step on the answers Numerical answers in the yellow cellsarrow_forwardShow all workarrow_forwardShow all workarrow_forward
arrow_back_ios
SEE MORE QUESTIONS
arrow_forward_ios
Recommended textbooks for you
 Glencoe Algebra 1, Student Edition, 9780079039897...AlgebraISBN:9780079039897Author:CarterPublisher:McGraw Hill
 Big Ideas Math A Bridge To Success Algebra 1: Stu...AlgebraISBN:9781680331141Author:HOUGHTON MIFFLIN HARCOURTPublisher:Houghton Mifflin Harcourt
 Holt Mcdougal Larson Pre-algebra: Student Edition...AlgebraISBN:9780547587776Author:HOLT MCDOUGALPublisher:HOLT MCDOUGAL
 Functions and Change: A Modeling Approach to Coll...AlgebraISBN:9781337111348Author:Bruce Crauder, Benny Evans, Alan NoellPublisher:Cengage Learning
Glencoe Algebra 1, Student Edition, 9780079039897...
Algebra
ISBN:9780079039897
Author:Carter
Publisher:McGraw Hill
Big Ideas Math A Bridge To Success Algebra 1: Stu...
Algebra
ISBN:9781680331141
Author:HOUGHTON MIFFLIN HARCOURT
Publisher:Houghton Mifflin Harcourt
Holt Mcdougal Larson Pre-algebra: Student Edition...
Algebra
ISBN:9780547587776
Author:HOLT MCDOUGAL
Publisher:HOLT MCDOUGAL
Functions and Change: A Modeling Approach to Coll...
Algebra
ISBN:9781337111348
Author:Bruce Crauder, Benny Evans, Alan Noell
Publisher:Cengage Learning
what is Research Design, Research Design Types, and Research Design Methods; Author: Educational Hub;https://www.youtube.com/watch?v=LpmGSioXxdo;License: Standard YouTube License, CC-BY