
Concept explainers
Videos
A new type of smoke detector battery is developed. From laboratory tests under standard conditions, the half-lives (defined as less than 50 percent of full charge) of 20 batteries are shown below. (a) Make a histogram of the data and/or a

(a)
Sketch a histogram and normal probability plot for the sample.
Explain whether the battery half-life can be assumed normal or not.
Answer to Problem 55CE
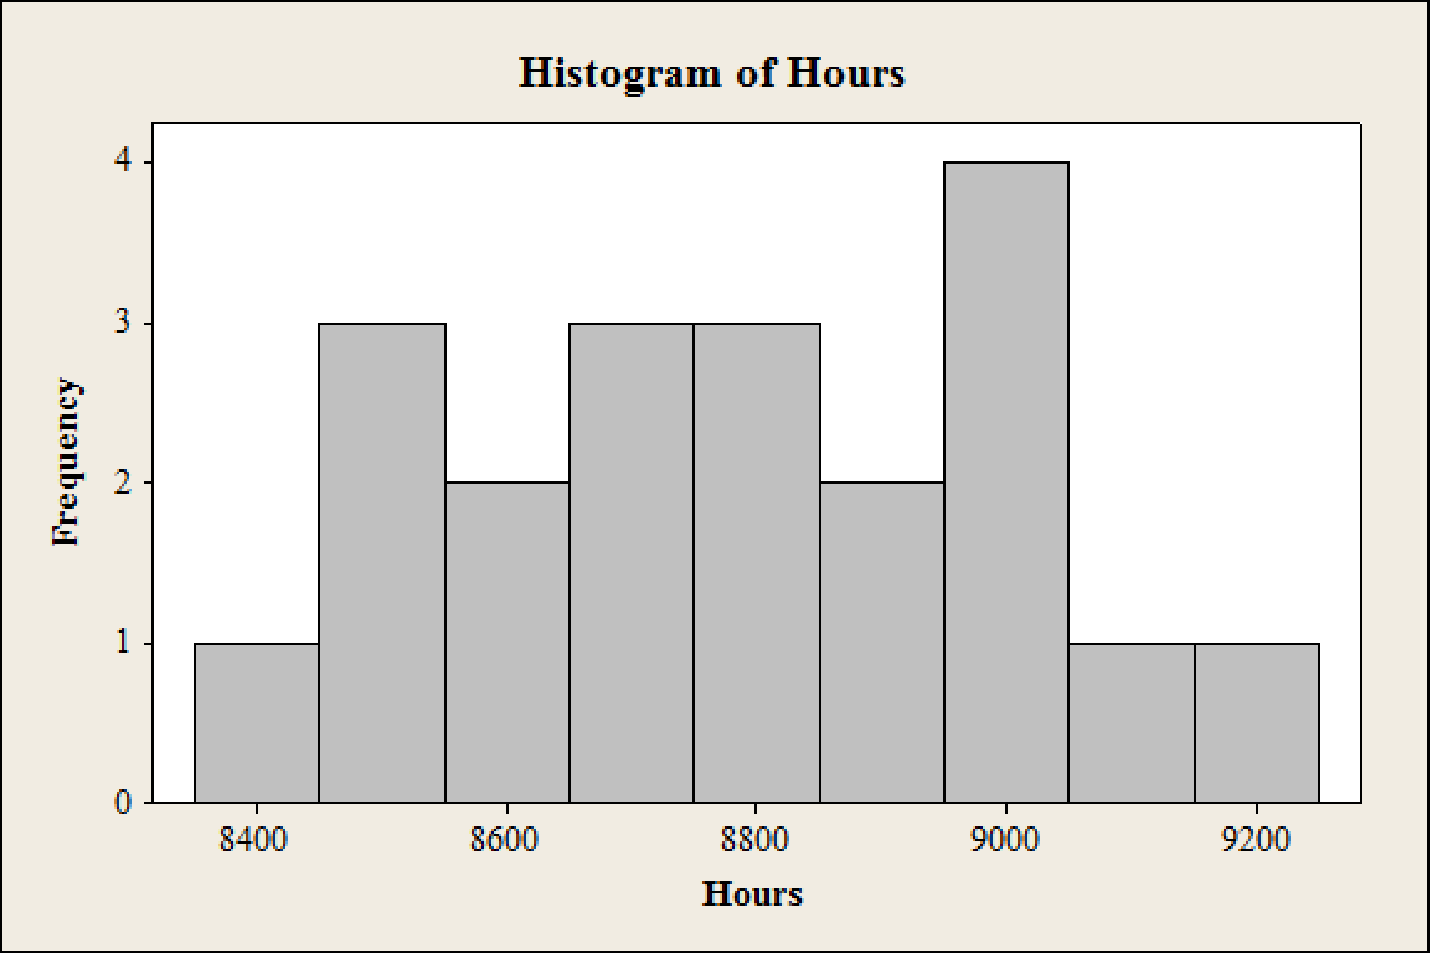
The histogram for the sample is,
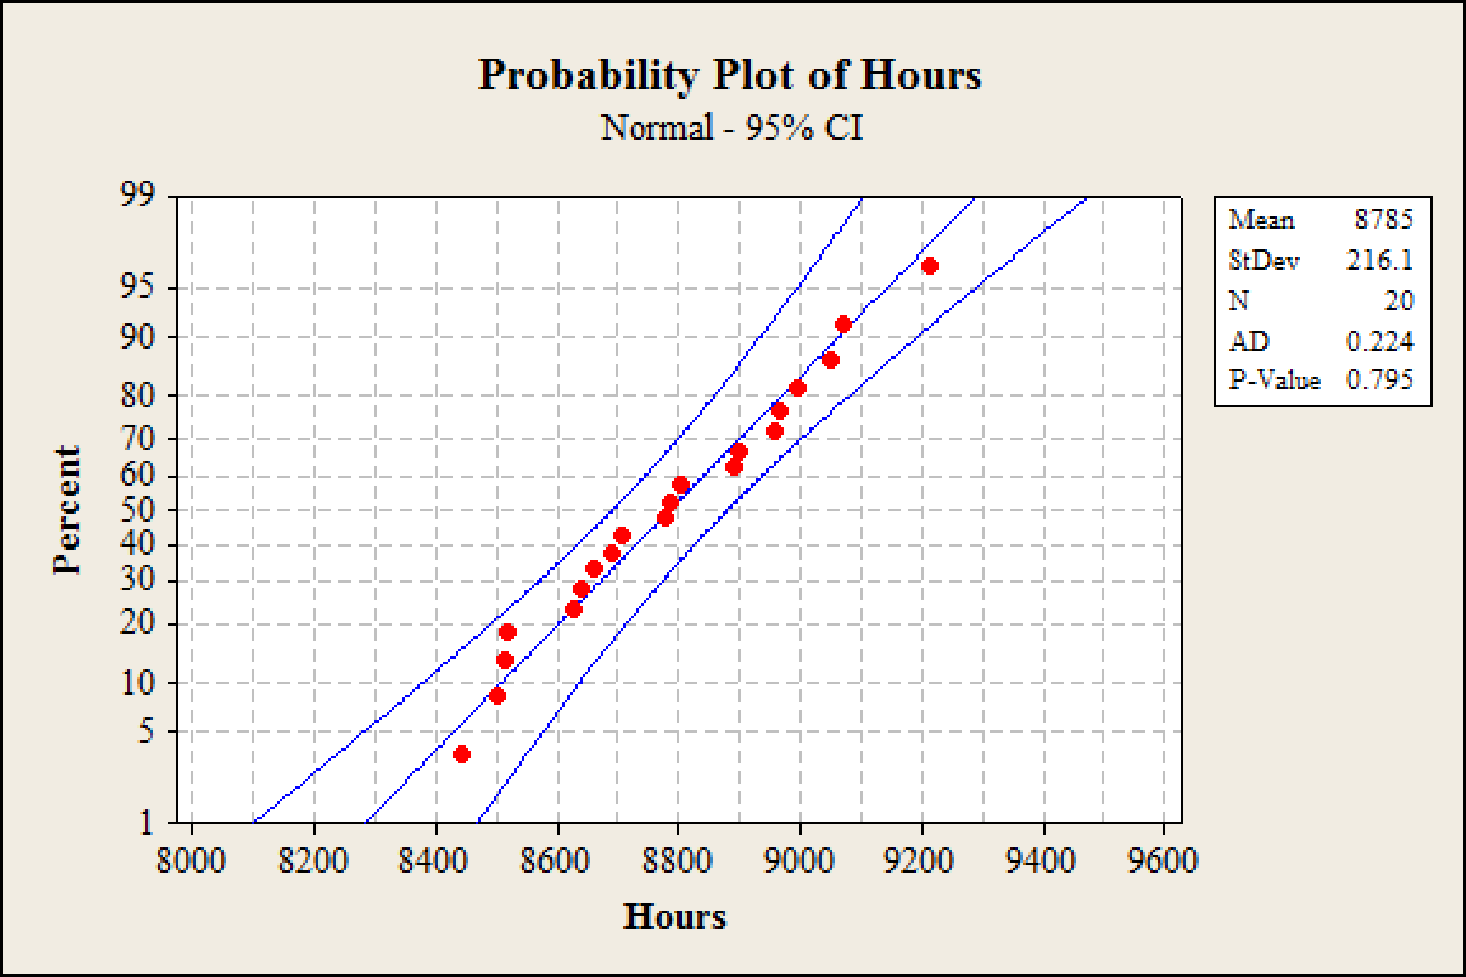
The normal probability plot for the sample is,
The battery half-life can be assumed normal.
Explanation of Solution
Calculation:
The given information is that, the half-lives of the 20 batteries are considered.
Histogram for hours:
Software procedure:
Step-by-step procedure to obtain the histogram for ‘hours’ using the MINITAB software:
- • Choose Graph > Histogram.
- • Choose Simple, and then click OK.
- • In Graph variables, enter the corresponding column ‘Hours’.
- • Click OK
Normal Probability plot for hours:
Software procedure:
Step-by-step procedure to obtain the normal probability plot for ‘hours’ using the MINITAB software:
- • Choose Graph > Probability Plot.
- • Choose Single, and then click OK.
- • In Graph variables, enter the column of Hours.
- • Click OK.
Justification: From the histogram it can be observed that the hours’ is slightly bell-shaped and could be slightly normal. Also, from the normal probability plot it can be observed that the data points of ‘hours all lies within the lines forming the linear pattern and is approximately normal. Overall the distribution of the half-life battery is normally distributed.
Hence, battery half-life can be assumed normal.
(b)
Find the centerline and control limits for the
Answer to Problem 55CE
The centerline is 8,760 and control limits for an
Explanation of Solution
Calculation:
The given information is that, the subgroup size is
Control limits with known
If the values of
In the formula,
Control limits for an
Substitute,
Hence, the control limits for an
(c)
Find the centerline and control limits for the
Answer to Problem 55CE
The centerline is 8,784.8 and control limits for an
Explanation of Solution
Calculation:
The given information is that, the half-lives of the 20 batteries are considered. The subgroups size is
Software procedure:
Step-by-step procedure to obtain the sample mean and standard deviation for ‘hours’ using the MINITAB software:
- • Choose Stat > Basic Statistics > Display Descriptive Statistics.
- • In Variables enter the columns Hours.
- • Choose option statistics, and select Mean, Standard deviation.
- • Click OK.
Output using MINITAB software is,
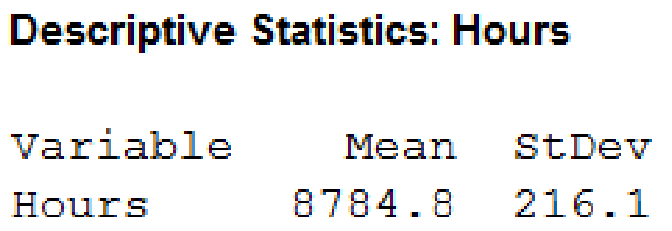
The sample mean is 8,784.8 and sample standard deviation is 216.1.
Empirical control limits:
If the value of
In the formula,
Control limits for an
Substitute,
Hence, the control limits for an
(d)
Explain whether the control limits from the sample would be reliable or not.
Suggest an alternative.
Answer to Problem 55CE
The control limits from the sample would not be reliable.
The alternative approach is constructing R chart.
Explanation of Solution
Justification: The mean of battery half-life is
Alternative: Since the sample size is large for determining the capability of the process the range chart can be used as an alternative approach. The R chart is a control chart that shows the changes of the range value over a period of time and determines variation around the mean by using the sample ranges.
Want to see more full solutions like this?
Chapter 17 Solutions
Applied Statistics in Business and Economics


- 3. Prove that, for any random variable X, the minimum of E(X - a)² is attained for a = EX. Provedarrow_forward7. Cantelli's inequality. Let X be a random variable with finite variance, o². (a) Prove that, for x ≥ 0, P(X EX2x)≤ 02 x² +0² 202 P(|X - EX2x)<≤ (b) Find X assuming two values where there is equality. (c) When is Cantelli's inequality better than Chebyshev's inequality? (d) Use Cantelli's inequality to show that med (X) - EX ≤ o√√3; recall, from Proposition 6.1, that an application of Chebyshev's inequality yields the bound o√√2. (e) Generalize Cantelli's inequality to moments of order r 1.arrow_forwardThe college hiking club is having a fundraiser to buy new equipment for fall and winter outings. The club is selling Chinese fortune cookies at a price of $2 per cookie. Each cookie contains a piece of paper with a different number written on it. A random drawing will determine which number is the winner of a dinner for two at a local Chinese restaurant. The dinner is valued at $32. Since fortune cookies are donated to the club, we can ignore the cost of the cookies. The club sold 718 cookies before the drawing. Lisa bought 13 cookies. Lisa's expected earnings can be found by multiplying the value of the dinner by the probability that she will win. What are Lisa's expected earnings? Round your answer to the nearest cent.arrow_forward
- The Honolulu Advertiser stated that in Honolulu there was an average of 659 burglaries per 400,000 households in a given year. In the Kohola Drive neighborhood there are 321 homes. Let r be the number of homes that will be burglarized in a year. Use the formula for Poisson distribution. What is the value of p, the probability of success, to four decimal places?arrow_forwardThe college hiking club is having a fundraiser to buy new equipment for fall and winter outings. The club is selling Chinese fortune cookies at a price of $2 per cookie. Each cookie contains a piece of paper with a different number written on it. A random drawing will determine which number is the winner of a dinner for two at a local Chinese restaurant. The dinner is valued at $32. Since fortune cookies are donated to the club, we can ignore the cost of the cookies. The club sold 718 cookies before the drawing. Lisa bought 13 cookies. Lisa's expected earnings can be found by multiplying the value of the dinner by the probability that she will win. What are Lisa's expected earnings? Round your answer to the nearest cent.arrow_forwardWhat was the age distribution of nurses in Great Britain at the time of Florence Nightingale? Thanks to Florence Nightingale and the British census of 1851, we have the following information (based on data from the classic text Notes on Nursing, by Florence Nightingale). Note: In 1851 there were 25,466 nurses in Great Britain. Furthermore, Nightingale made a strict distinction between nurses and domestic servants. Use a histogram and graph the probability distribution. Using the graph of the probability distribution determine the probability that a British nurse selected at random in 1851 would be 40 years of age or older. Round your answer to nearest thousandth. Age range (yr) 20–29 30–39 40–49 50–59 60–69 70–79 80+ Midpoint (x) 24.5 34.5 44.5 54.5 64.5 74.5 84.5 Percent of nurses 5.7% 9.7% 19.5% 29.2% 25.0% 9.1% 1.8%arrow_forward
- What was the age distribution of nurses in Great Britain at the time of Florence Nightingale? Thanks to Florence Nightingale and the British census of 1851, we have the following information (based on data from the classic text Notes on Nursing, by Florence Nightingale). Note: In 1851 there were 25,466 nurses in Great Britain. Furthermore, Nightingale made a strict distinction between nurses and domestic servants. Use a histogram and graph the probability distribution. Using the graph of the probability distribution determine the probability that a British nurse selected at random in 1851 would be 40 years of age or older. Round your answer to nearest thousandth. Age range (yr) 20–29 30–39 40–49 50–59 60–69 70–79 80+ Midpoint (x) 24.5 34.5 44.5 54.5 64.5 74.5 84.5 Percent of nurses 5.7% 9.7% 19.5% 29.2% 25.0% 9.1% 1.8%arrow_forwardThere are 4 radar stations and the probability of a single radar station detecting an enemy plane is 0.55. Make a histogram for the probability distribution.arrow_forwardshow all stepsarrow_forward
- Most people know that the probability of getting a head when you flip a fair coin is . You want to use the relative frequency of the event to show that the probability is . How many times should you simulate flipping the coin in the experiment? Would it be better to use 300 trials or 3000 trials? Explain.arrow_forwardThe qualified applicant pool for eight management trainee positions consists of ten women and six men. How many different groups of applicants can be selected for the positionsarrow_forwardYou want to make a salad from whatever vegetable you have in the fridge. You have seven different tomatoes. There are 2 red tomatoes, 4 yellow tomatoes, and one black tomato in the fridge. You have three different bell peppers. There is 1 red pepper, 1 yellow pepper, and 1 green pepper. What is the probability of randomly choosing a vegetable and getting a red tomato, and a green pepper? Round your answer to four decimal places.arrow_forward
 Glencoe Algebra 1, Student Edition, 9780079039897...AlgebraISBN:9780079039897Author:CarterPublisher:McGraw Hill
 Big Ideas Math A Bridge To Success Algebra 1: Stu...AlgebraISBN:9781680331141Author:HOUGHTON MIFFLIN HARCOURTPublisher:Houghton Mifflin Harcourt