
Applied Statistics in Business and Economics
5th Edition
ISBN: 9781259329050
Author: DOANE
Publisher: MCG
expand_more
expand_more
format_list_bulleted
Videos
Textbook Question
Chapter 17, Problem 64CE
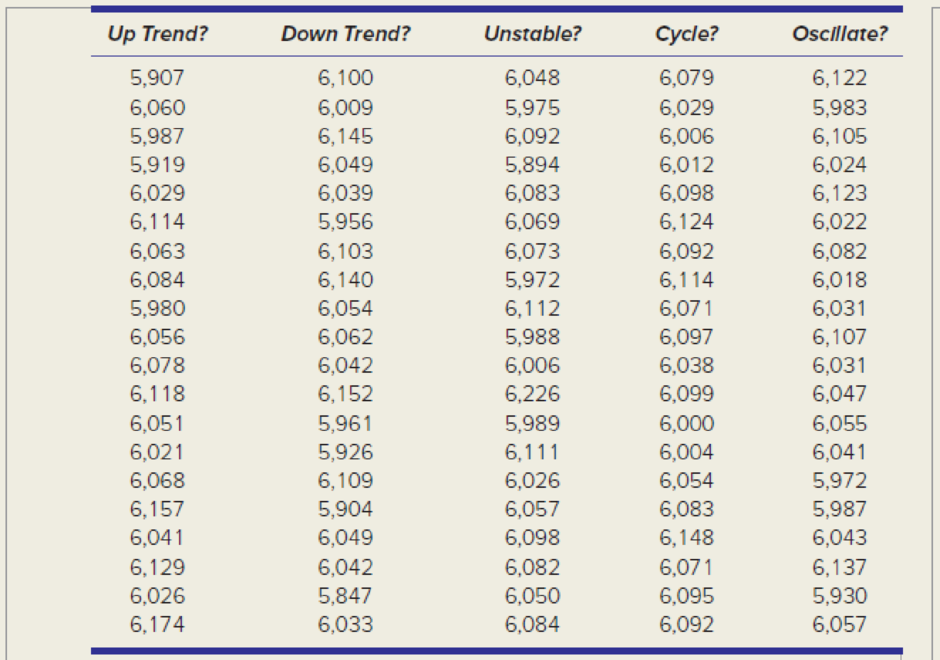
Refer to the bolt strength problem 17.47. Assuming μ = 6,050 and σ = 100 with n = 3, then LCL = 5,876.8 and UCL = 6,223.2. Below are five sets of 20 sample means using n = 3. Test each set of means for the pattern suggested in the column heading. This is a visual judgment question, though you can apply Rules 1–4 if you wish.
Expert Solution & Answer
Want to see the full answer?
Check out a sample textbook solution
Students have asked these similar questions
Why researchers are interested in describing measures of the center and measures of variation of a data set?
WHAT IS THE SOLUTION?
The following ordered data list shows the data speeds for cell phones used by a
telephone company at an airport:
A. Calculate the Measures of Central Tendency from the ungrouped data list.
B. Group the data in an appropriate frequency table.
C. Calculate the Measures of Central Tendency using the table in point B.
0.8
1.4
1.8
1.9
3.2
3.6
4.5
4.5
4.6
6.2
6.5
7.7
7.9
9.9
10.2
10.3
10.9
11.1
11.1
11.6
11.8
12.0
13.1
13.5
13.7
14.1
14.2
14.7
15.0
15.1
15.5
15.8
16.0
17.5
18.2
20.2
21.1
21.5
22.2
22.4
23.1
24.5
25.7
28.5
34.6
38.5
43.0
55.6
71.3
77.8
Chapter 17 Solutions
Applied Statistics in Business and Economics
Ch. 17.1 - Define (a) productivity, (b) quality control, and...Ch. 17.1 - Explain the relationship between productivity and...Ch. 17.1 - Explain the difference between common cause...Ch. 17.1 - Prob. 4SECh. 17.1 - Explain the role of statisticians in quality...Ch. 17.2 - Prob. 6SECh. 17.2 - Prob. 7SECh. 17.3 - Prob. 8SECh. 17.3 - Prob. 9SECh. 17.3 - Identify three common quality improvement programs...
Ch. 17.3 - Why is the quality improvement process...Ch. 17.3 - Prob. 12SECh. 17.3 - Prob. 13SECh. 17.4 - Prob. 14SECh. 17.4 - Prob. 15SECh. 17.5 - (a) To construct control limits for an x chart,...Ch. 17.5 - Prob. 17SECh. 17.5 - List four rules for detecting abnormal (special...Ch. 17.5 - Set up control limits for an x chart, given x =...Ch. 17.5 - Prob. 20SECh. 17.5 - Prob. 21SECh. 17.5 - To print 8.5 5.5 note pads, a copy shop uses...Ch. 17.6 - Prob. 23SECh. 17.6 - Prob. 24SECh. 17.7 - Prob. 25SECh. 17.7 - Prob. 26SECh. 17.7 - Prob. 27SECh. 17.7 - Prob. 28SECh. 17.9 - Prob. 29SECh. 17.9 - Prob. 30SECh. 17.9 - Prob. 31SECh. 17 - Define (a) quality, (b) process, and (c)...Ch. 17 - Prob. 2CRCh. 17 - Prob. 3CRCh. 17 - Prob. 4CRCh. 17 - Prob. 5CRCh. 17 - Prob. 6CRCh. 17 - (a) Who was W. Edwards Deming and why is he...Ch. 17 - List three influential thinkers other than Deming...Ch. 17 - (a) Briefly explain each acronym: TQM, BPR, SQC,...Ch. 17 - (a) What is shown on the x chart? (b) Name three...Ch. 17 - Prob. 11CRCh. 17 - Prob. 12CRCh. 17 - Prob. 13CRCh. 17 - Prob. 14CRCh. 17 - Prob. 15CRCh. 17 - Briefly explain (a) the overadjustment problem,...Ch. 17 - Prob. 32CECh. 17 - Prob. 33CECh. 17 - Prob. 34CECh. 17 - Define three quality metrics that might be used to...Ch. 17 - Prob. 36CECh. 17 - Prob. 37CECh. 17 - Prob. 38CECh. 17 - Prob. 39CECh. 17 - Use your favorite Internet search engine to look...Ch. 17 - Make a fishbone chart (cause-and-effect diagram)...Ch. 17 - Make a fishbone chart (cause-and-effect diagram)...Ch. 17 - Make a fishbone chart (cause-and-effect diagram)...Ch. 17 - Prob. 44CECh. 17 - In painting an automobile, the thickness of the...Ch. 17 - Prob. 46CECh. 17 - Prob. 47CECh. 17 - Prob. 48CECh. 17 - In painting an automobile at the factory, the...Ch. 17 - Prob. 50CECh. 17 - Prob. 51CECh. 17 - Prob. 52CECh. 17 - Prob. 53CECh. 17 - A Nabisco Fig Newton has a process mean weight of...Ch. 17 - A new type of smoke detector battery is developed....Ch. 17 - Prob. 56CECh. 17 - Prob. 57CECh. 17 - Prob. 58CECh. 17 - Each gum drop in two bags of Sathers Gum Drops was...Ch. 17 - Prob. 60CECh. 17 - Prob. 61CECh. 17 - Prob. 62CECh. 17 - Prob. 63CECh. 17 - Refer to the bolt strength problem 17.47. Assuming...Ch. 17 - Refer to the paint problem 17.49 with =1.00 and ...
Knowledge Booster


Learn more about
Need a deep-dive on the concept behind this application? Look no further. Learn more about this topic, statistics and related others by exploring similar questions and additional content below.Similar questions
- II Consider the following data matrix X: X1 X2 0.5 0.4 0.2 0.5 0.5 0.5 10.3 10 10.1 10.4 10.1 10.5 What will the resulting clusters be when using the k-Means method with k = 2. In your own words, explain why this result is indeed expected, i.e. why this clustering minimises the ESS map.arrow_forwardwhy the answer is 3 and 10?arrow_forwardPS 9 Two films are shown on screen A and screen B at a cinema each evening. The numbers of people viewing the films on 12 consecutive evenings are shown in the back-to-back stem-and-leaf diagram. Screen A (12) Screen B (12) 8 037 34 7 6 4 0 534 74 1645678 92 71689 Key: 116|4 represents 61 viewers for A and 64 viewers for B A second stem-and-leaf diagram (with rows of the same width as the previous diagram) is drawn showing the total number of people viewing films at the cinema on each of these 12 evenings. Find the least and greatest possible number of rows that this second diagram could have. TIP On the evening when 30 people viewed films on screen A, there could have been as few as 37 or as many as 79 people viewing films on screen B.arrow_forward
- Q.2.4 There are twelve (12) teams participating in a pub quiz. What is the probability of correctly predicting the top three teams at the end of the competition, in the correct order? Give your final answer as a fraction in its simplest form.arrow_forwardThe table below indicates the number of years of experience of a sample of employees who work on a particular production line and the corresponding number of units of a good that each employee produced last month. Years of Experience (x) Number of Goods (y) 11 63 5 57 1 48 4 54 5 45 3 51 Q.1.1 By completing the table below and then applying the relevant formulae, determine the line of best fit for this bivariate data set. Do NOT change the units for the variables. X y X2 xy Ex= Ey= EX2 EXY= Q.1.2 Estimate the number of units of the good that would have been produced last month by an employee with 8 years of experience. Q.1.3 Using your calculator, determine the coefficient of correlation for the data set. Interpret your answer. Q.1.4 Compute the coefficient of determination for the data set. Interpret your answer.arrow_forwardCan you answer this question for mearrow_forward
- Techniques QUAT6221 2025 PT B... TM Tabudi Maphoru Activities Assessments Class Progress lIE Library • Help v The table below shows the prices (R) and quantities (kg) of rice, meat and potatoes items bought during 2013 and 2014: 2013 2014 P1Qo PoQo Q1Po P1Q1 Price Ро Quantity Qo Price P1 Quantity Q1 Rice 7 80 6 70 480 560 490 420 Meat 30 50 35 60 1 750 1 500 1 800 2 100 Potatoes 3 100 3 100 300 300 300 300 TOTAL 40 230 44 230 2 530 2 360 2 590 2 820 Instructions: 1 Corall dawn to tha bottom of thir ceraan urina se se tha haca nariad in archerca antarand cubmit Q Search ENG US 口X 2025/05arrow_forwardThe table below indicates the number of years of experience of a sample of employees who work on a particular production line and the corresponding number of units of a good that each employee produced last month. Years of Experience (x) Number of Goods (y) 11 63 5 57 1 48 4 54 45 3 51 Q.1.1 By completing the table below and then applying the relevant formulae, determine the line of best fit for this bivariate data set. Do NOT change the units for the variables. X y X2 xy Ex= Ey= EX2 EXY= Q.1.2 Estimate the number of units of the good that would have been produced last month by an employee with 8 years of experience. Q.1.3 Using your calculator, determine the coefficient of correlation for the data set. Interpret your answer. Q.1.4 Compute the coefficient of determination for the data set. Interpret your answer.arrow_forwardQ.3.2 A sample of consumers was asked to name their favourite fruit. The results regarding the popularity of the different fruits are given in the following table. Type of Fruit Number of Consumers Banana 25 Apple 20 Orange 5 TOTAL 50 Draw a bar chart to graphically illustrate the results given in the table.arrow_forward
- Q.2.3 The probability that a randomly selected employee of Company Z is female is 0.75. The probability that an employee of the same company works in the Production department, given that the employee is female, is 0.25. What is the probability that a randomly selected employee of the company will be female and will work in the Production department? Q.2.4 There are twelve (12) teams participating in a pub quiz. What is the probability of correctly predicting the top three teams at the end of the competition, in the correct order? Give your final answer as a fraction in its simplest form.arrow_forwardQ.2.1 A bag contains 13 red and 9 green marbles. You are asked to select two (2) marbles from the bag. The first marble selected will not be placed back into the bag. Q.2.1.1 Construct a probability tree to indicate the various possible outcomes and their probabilities (as fractions). Q.2.1.2 What is the probability that the two selected marbles will be the same colour? Q.2.2 The following contingency table gives the results of a sample survey of South African male and female respondents with regard to their preferred brand of sports watch: PREFERRED BRAND OF SPORTS WATCH Samsung Apple Garmin TOTAL No. of Females 30 100 40 170 No. of Males 75 125 80 280 TOTAL 105 225 120 450 Q.2.2.1 What is the probability of randomly selecting a respondent from the sample who prefers Garmin? Q.2.2.2 What is the probability of randomly selecting a respondent from the sample who is not female? Q.2.2.3 What is the probability of randomly…arrow_forwardTest the claim that a student's pulse rate is different when taking a quiz than attending a regular class. The mean pulse rate difference is 2.7 with 10 students. Use a significance level of 0.005. Pulse rate difference(Quiz - Lecture) 2 -1 5 -8 1 20 15 -4 9 -12arrow_forward
arrow_back_ios
SEE MORE QUESTIONS
arrow_forward_ios
Recommended textbooks for you
 Glencoe Algebra 1, Student Edition, 9780079039897...AlgebraISBN:9780079039897Author:CarterPublisher:McGraw Hill
 Holt Mcdougal Larson Pre-algebra: Student Edition...AlgebraISBN:9780547587776Author:HOLT MCDOUGALPublisher:HOLT MCDOUGAL
 College Algebra (MindTap Course List)AlgebraISBN:9781305652231Author:R. David Gustafson, Jeff HughesPublisher:Cengage Learning
Glencoe Algebra 1, Student Edition, 9780079039897...
Algebra
ISBN:9780079039897
Author:Carter
Publisher:McGraw Hill
Holt Mcdougal Larson Pre-algebra: Student Edition...
Algebra
ISBN:9780547587776
Author:HOLT MCDOUGAL
Publisher:HOLT MCDOUGAL
College Algebra (MindTap Course List)
Algebra
ISBN:9781305652231
Author:R. David Gustafson, Jeff Hughes
Publisher:Cengage Learning
How to make Frequency Distribution Table / Tally Marks and Frequency Distribution Table; Author: Reenu Math;https://www.youtube.com/watch?v=i_A6RiE8tLE;License: Standard YouTube License, CC-BY
Frequency distribution table in statistics; Author: Math and Science;https://www.youtube.com/watch?v=T7KYO76DoOE;License: Standard YouTube License, CC-BY
Frequency Distribution Table for Grouped/Continuous data | Math Dot Com; Author: Maths dotcom;https://www.youtube.com/watch?v=ErnccbXQOPY;License: Standard Youtube License